
覆盖网格而不是绘制在上面。
覆盖网格而不是绘制在上面。
提问于 2015-11-29 23:58:02
我有一个ggplot2图,如下所示:
请注意,网格或轴线线不显示通过丝带。处理这一问题的一种方法是改变缎带的alpha属性;然而,这会使较浅的颜色变得太轻。
另一种方法是将网格/轴线画在缎带的顶部,而不是在它们下面。如何实现此呈现顺序?
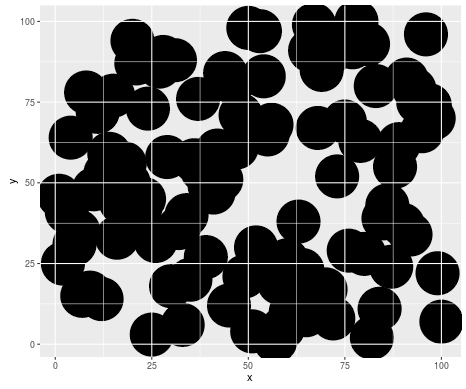
当然,ggplot2生成的任何情节都可以被问到这个问题。但是,说明问题的复制和粘贴命令如下所示:
ggplot(data.frame(x=sample(1:100),y=sample(1:100)),aes(x=x,y=y))+geom_point(size=20)回答 2
Stack Overflow用户
回答已采纳
发布于 2018-02-19 11:19:16
ggplot在theme()中引入了一个选项,允许您在2015年6月18日使用拔号993完成此操作。
添加到你的情节:
+ theme(
  panel.background = element_rect(fill = NA),
  panel.ontop = TRUE
)在ggplot 文档中有一个例子。
Stack Overflow用户
发布于 2015-11-30 02:17:19
您可以使用grid包功能从绘图中提取网格线,然后重新绘制它们,这将避免在添加水平线或垂直线时使用一些手动规范。
library(ggplot2)
library(grid)

# Draw your plot
ggplot(data.frame(x=sample(1:100),y=sample(1:100)), aes(x=x,y=y))+
   geom_point(size=20)

# This extracts the panel including major and minor gridlines
lines <- grid.get("grill.gTree", grep=TRUE)

# Redraw plot without the gridlines
# This is done, as otherwise when the lines are added again they look thicker
last_plot() +
  theme(panel.grid.minor = element_blank(),
        panel.grid.major = element_blank())

# Navigate to relevant viewport
# To see these use grid.ls(viewports=TRUE)
seekViewport("panel.3-4-3-4")

# Redraw lines
grid.draw(lines$children[-1])
产
或者,如果您想要自动添加ggplot中的垂直和水平线(如Narendra的答案),但是不需要手动指定断点,您可以使用ggplot_build(p)访问它们的位置,其中p是您的绘图。
对于一个有面的图形来说,这可能是值得的。相同的过程,除了您选择多条线和面板,然后只是循环通过它们来绘制。
# New plot with facets
ggplot(mtcars, aes(mpg, wt)) + geom_point(size=10) + facet_grid(am~cyl)

gr <- grid.ls(print=FALSE)
# Get the gTree for each of the panels, as before
lines <- lapply(gr$name[grep("grill.gTree", gr$name)], grid.get)

last_plot() +
  theme(panel.grid.minor = element_blank(),
        panel.grid.major = element_blank())

# Get the names from each of the panels
panels <- gr$name[grep("panel.\\d", gr$name)]

# Loop through the panels redrawing the gridlines
for(i in 1:length(panels)) {
             seekViewport(panels[i])
             grid.draw(lines[[i]]$children[-1])
             }
这也适用于没有事实的阴谋。
页面原文内容由Stack Overflow提供。腾讯云小微IT领域专用引擎提供翻译支持
原文链接:
https://stackoverflow.com/questions/33989595
复制相关文章
相似问题
腾讯云开发者

Copyright © 2013 - 2026 Tencent Cloud. All Rights Reserved. 腾讯云 版权所有
深圳市腾讯计算机系统有限公司 ICP备案/许可证号:粤B2-20090059 ![]() 粤公网安备44030502008569号
粤公网安备44030502008569号
腾讯云计算(北京)有限责任公司 京ICP证150476号 | 京ICP备11018762号