
利用ggvis实现基于不同变量的双ggvis
利用ggvis实现基于不同变量的双ggvis
提问于 2015-11-24 07:21:44
df <- data.frame(X1 = rep(1:5,1), X2 = rep(4:8,1), var1 = sample(1:10,5), row.names = c(1:5))
library("ggvis")
graph <- df %>%
        ggvis(~X1) %>%
        layer_lines(y = ~ var1) %>%
        add_axis("y", orient = "left", title = "var1") %>%
        add_axis("x", orient = "bottom", title = "X1")  %>%
        add_axis("x", orient = "top", title = "X2" )
graph
显然,顶部x轴(X2)在这里是不正确的,因为它引用了与X1相同的变量。我知道如何在ggvis中创建一个缩放的双y轴。但是我如何在不同的X上创建一个相似的双轴呢?这两个X轴应该引用不同的变量(本例中为X1和X2 )。
我知道做双X轴可能是个坏主意。但我的一个工作数据集可能需要我这样做。如有任何意见和建议,敬请见谅!
回答 1
Stack Overflow用户
回答已采纳
发布于 2015-11-24 10:35:26
第二个轴需要有一个“名称”,以便轴知道要反映哪个变量。见下文:
df <- data.frame(X1 = rep(1:5,1),
                 X2 = rep(4:8,1),
                 var1 = sample(1:10,5),
                 row.names = c(1:5))

library("ggvis")
df %>%
  ggvis(~X1) %>%
  #this is the line plotted
  layer_lines(y = ~ var1) %>%
  #and this is the bottom axis as plotted normally
  add_axis("x", orient = "bottom", title = "X1")  %>%
  #now we add a second axis and we name it 'x2'. The name is given
  #at the scale argument
  add_axis("x", scale = 'x2',  orient = "top", title = "X2" ) %>%
  #and now we plot the second x-axis using the name created above
  #i.e. scale='x2'
  layer_lines(prop('x' , ~X2,  scale='x2'))
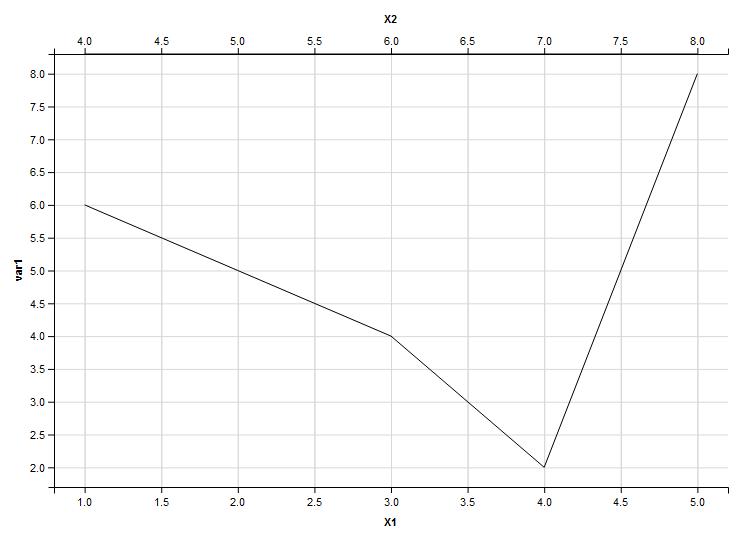
如您所见,顶部x轴反映了您的X2变量,范围在4到8之间。
另外,还需要注意:您不需要rep(4:8,1)从4到8创建向量,只需使用返回相同向量的4:8即可。
页面原文内容由Stack Overflow提供。腾讯云小微IT领域专用引擎提供翻译支持
原文链接:
https://stackoverflow.com/questions/33887604
复制相关文章
相似问题
腾讯云开发者

Copyright © 2013 - 2026 Tencent Cloud. All Rights Reserved. 腾讯云 版权所有
深圳市腾讯计算机系统有限公司 ICP备案/许可证号:粤B2-20090059 ![]() 粤公网安备44030502008569号
粤公网安备44030502008569号
腾讯云计算(北京)有限责任公司 京ICP证150476号 | 京ICP备11018762号