
Kibana只显示有限数量的数据- ELK Stack
我使用logstash解析了一个apache访问日志文件,它成功地解析了命令提示符窗口中的所有日志。但是当我打开Kibana的时候,它只显示了其中的8个。为什么它不显示所有分析过的日志?
更新:
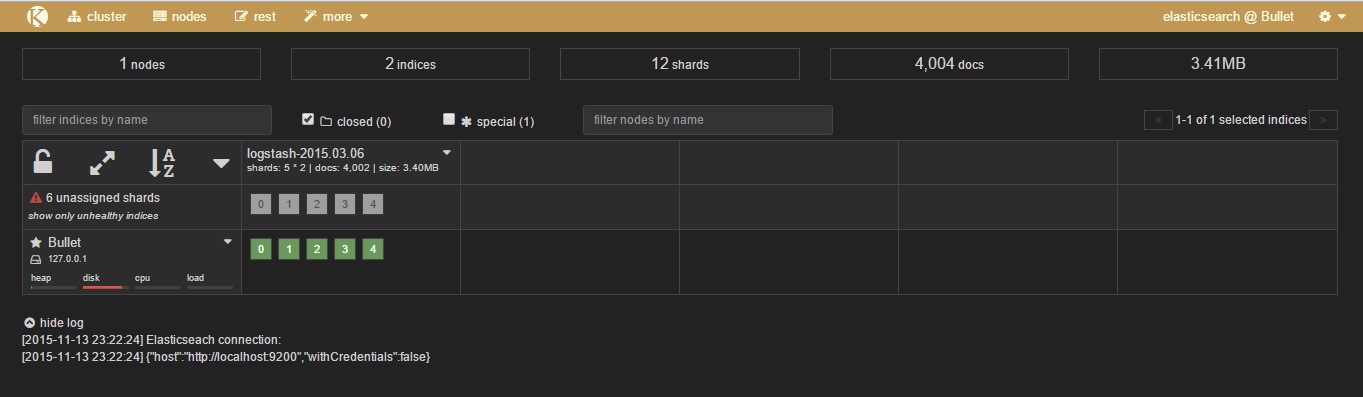
我重新开始重新安装elasticsearch-4.2.0、logstash-2.0.0和Kibana 4。我的日志文件名为http_access_2015-03-06_log,它正在elasticsearch中被解析和显示,但没有显示任何在Kibana上的日志。
科普夫
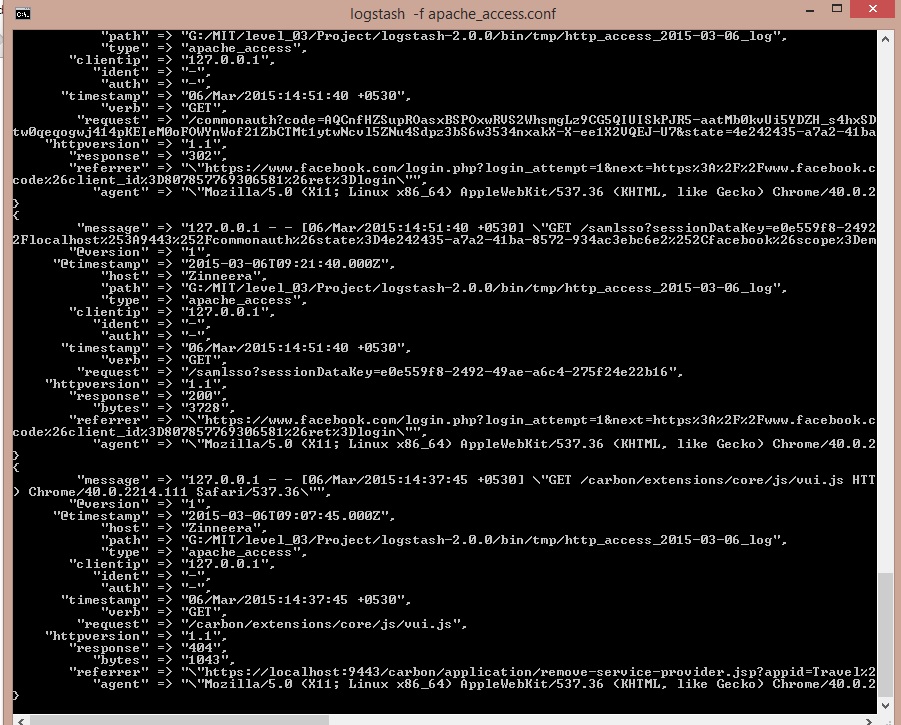
命令提示符输出:更新
.conf文件:更新
   input {
  file {
    path => "G:/MIT/level_03/Project/logstash-2.0.0/bin/tmp/*_log"
    #sincedb_path => "/dev/null"
    start_position => "beginning"
  }
}

filter {
  #grok {
  #  match => ["path", "G:/logstash-1.5.0/bin/tmp/(?<project>[^/_logs]+)/"]
  #}
  if [path] =~ "access" {
    mutate { replace => { type => "apache_access" } }
    grok {
      match => { "message" => "%{COMBINEDAPACHELOG}" }
    }
    date {
      match => [ "timestamp" , "dd/MMM/yyyy:HH:mm:ss Z" ]
    }
  } else if [path] =~ "error" {
    mutate { replace => { type => "apache_error" } }
  } else {
    mutate { replace => { type => "random_logs" } }
  }
}

output {
  elasticsearch {
   # action => "index"
    hosts => "localhost"
   # index => "test"
}
  stdout { codec => rubydebug }
}
这些是一些分析过的原木,但在基巴纳没有显示出来。
127.0.0.1 - 06/Mar/2015:10:26:31 +0530 "GET /carbon/ HTTP/1.1“302 - "Mozilla/5.0 (X11;Linux x86_64/537.36 (KHTML,类似壁虎) Chrome/40.0.2214.111 Safari/537.36“127.0.0.1 - 06/Mar/2015:10:26:31 +0530 "GET /carbon/admin/index.jsp HTTP/1.1”302 - "-“X11/5.0;Linux x86_64/537.36 (KHTML,类似壁虎) Chrome/40.0.2214.111 Safari/537.36“127.0.0.1 - 06/Mar/2015:10:26:32 +0530 "GET /carbon/admin/login.jsp HTTP/1.1”2003398 "-“X11/5.0;Linux x86_64/537.36 (KHTML,类似壁虎) Chrome/40.0.2214.111 Safari/537.36“127.0.0.1 - 06/Mar/2015:10:26:32 +0530 "GET /C/admin/css/global.css HTTP/1.1”200 5309 "https://localhost:9443/carbon/admin/login.jsp“https://localhost:9443/carbon/admin/login.jsp "Mozilla/5.0 (X11;Linux x86_64/537.36 (KHTML,类似壁虎) Chrome/40.0.2214.111 Safari/537.36“127.0.0.1 - 06/Mar/2015:10:26:32 +0530 "GET /C/styles/css/main.css HTTP/1.1”200 1361 "https://localhost:9443/carbon/admin/login.jsp“Mozilla/5.0”(X11;Linux x86_64/537.36 (KHTML,类似壁虎) Chrome/40.0.2214.111 Safari/537.36“127.0.0.1 - 06/Mar/2015:10:26:32 +0530 "GET /C/dialog/css/dialog.css HTTP/1.1”200 556 "https://localhost:9443/carbon/admin/login.jsp“https://localhost:9443/carbon/admin/login.jsp”https://localhost:9443/carbon/admin/login.jsp/5.0 (X11;Linux x86_64) AppleWebKit/537.36
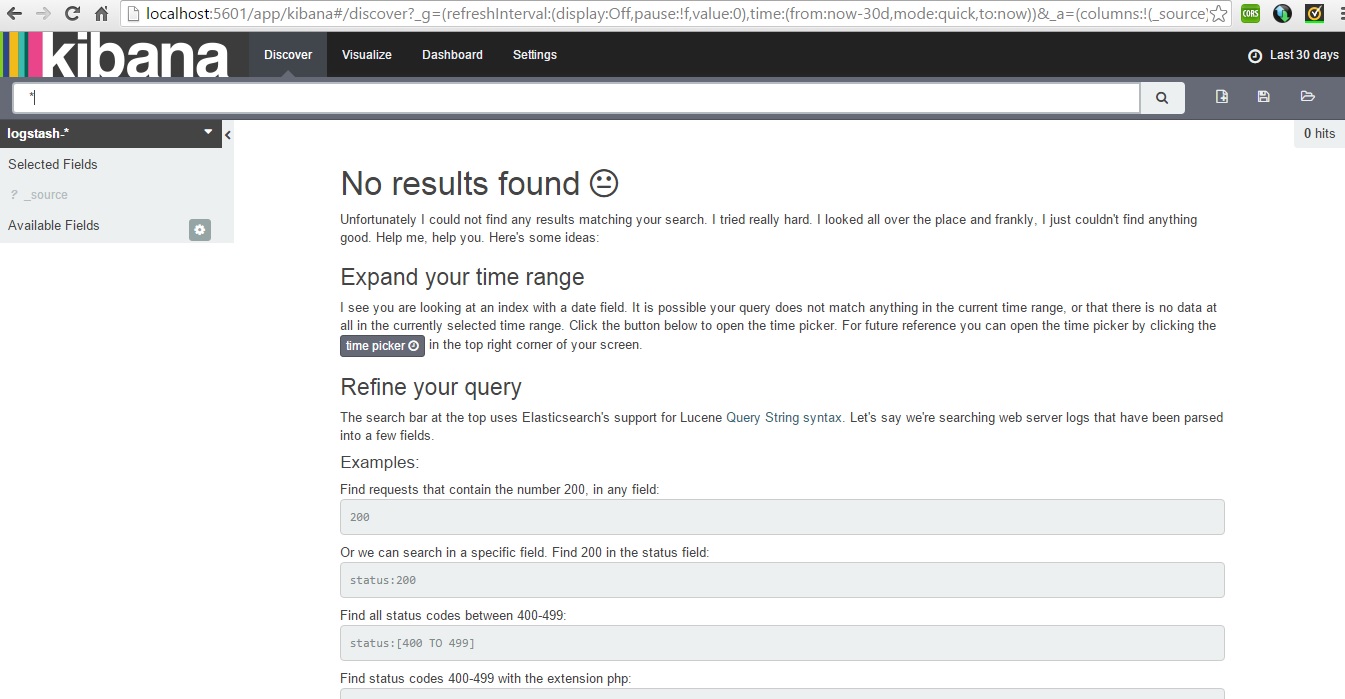
Kibana发现标签:更新
kibana.yml
# Kibana is served by a back end server. This controls which port to use.
# server.port: 5601

# The host to bind the server to.
# server.host: "0.0.0.0"

# The Elasticsearch instance to use for all your queries.
# elasticsearch.url: "http://localhost:9200"

# preserve_elasticsearch_host true will send the hostname specified in `elasticsearch`. If you set it to false,
# then the host you use to connect to *this* Kibana instance will be sent.
# elasticsearch.preserveHost: true

# Kibana uses an index in Elasticsearch to store saved searches, visualizations
# and dashboards. It will create a new index if it doesn't already exist.
# kibana.index: ".kibana"

# The default application to load.
# kibana.defaultAppId: "discover"

# If your Elasticsearch is protected with basic auth, this is the user credentials
# used by the Kibana server to perform maintenance on the kibana_index at startup. Your Kibana
# users will still need to authenticate with Elasticsearch (which is proxied through
# the Kibana server)
# elasticsearch.username: user
# elasticsearch.password: pass

# SSL for outgoing requests from the Kibana Server to the browser (PEM formatted)
# server.ssl.cert: /path/to/your/server.crt
# server.ssl.key: /path/to/your/server.key

# Optional setting to validate that your Elasticsearch backend uses the same key files (PEM formatted)
# elasticsearch.ssl.cert: /path/to/your/client.crt
# elasticsearch.ssl.key: /path/to/your/client.key

# If you need to provide a CA certificate for your Elasticsearch instance, put
# the path of the pem file here.
# elasticsearch.ssl.ca: /path/to/your/CA.pem

# Set to false to have a complete disregard for the validity of the SSL
# certificate.
# elasticsearch.ssl.verify: true

# Time in milliseconds to wait for elasticsearch to respond to pings, defaults to
# request_timeout setting
# elasticsearch.pingTimeout: 1500

# Time in milliseconds to wait for responses from the back end or elasticsearch.
# This must be > 0
# elasticsearch.requestTimeout: 300000

# Time in milliseconds for Elasticsearch to wait for responses from shards.
# Set to 0 to disable.
# elasticsearch.shardTimeout: 0

# Time in milliseconds to wait for Elasticsearch at Kibana startup before retrying
# elasticsearch.startupTimeout: 5000

# Set the path to where you would like the process id file to be created.
# pid.file: /var/run/kibana.pid

# If you would like to send the log output to a file you can set the path below.
# logging.dest: stdout

# Set this to true to suppress all logging output.
# logging.silent: false

# Set this to true to suppress all logging output except for error messages.
# logging.quiet: false

# Set this to true to log all events, including system usage information and all requests.
# logging.verbose
附注:Kiabna发现选项卡显示"_all“的所有数据
回答 1
Stack Overflow用户
发布于 2015-11-11 22:46:47
这里有几件事。
- 在您的
grok{}文件代码路径中只有一个access - 您正在获得_grokparsefailures,因此您的
grok { match => ["path", "G:/logstash-1.5.0/bin/tmp/(?<project>[^/_logs]+)/"] }块不匹配。 - 您可能会遇到这样的情况,即文件正被存储到用于logstash的自定义文件中,因此您只在第一次运行文件后才会在文件中看到新的记录。您需要找到并移除您的.sincedb,或者将其指向/dev/null之类的东西。
https://stackoverflow.com/questions/33657032
复制相似问题
腾讯云开发者

Copyright © 2013 - 2026 Tencent Cloud. All Rights Reserved. 腾讯云 版权所有
深圳市腾讯计算机系统有限公司 ICP备案/许可证号:粤B2-20090059 ![]() 粤公网安备44030502008569号
粤公网安备44030502008569号
腾讯云计算(北京)有限责任公司 京ICP证150476号 | 京ICP备11018762号