
autoplot.survfit中的变轴
autoplot.survfit中的变轴
提问于 2015-11-10 22:32:08
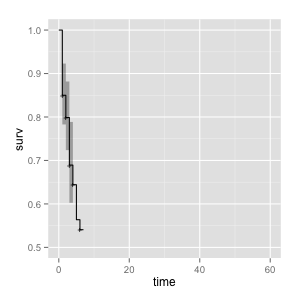
我试图改变我的Kaplan Meier生存函数的y轴。我正在使用自动绘图为一个survfit对象创建一个ggplot。它在survMisc库中。
输出当前的y轴为0到1,但我想将其更改为0.5到1。在Auto图中似乎没有允许我更改轴的参数。
如果这是可能的话,我也想改变我的刻度标记的间隔。它目前每2.5年(轴)有它,但我希望每年。
我已经从加州大学洛杉矶分校的网站附加了一个样本生存代码,但我的自动绘图代码是相同的在我的脚本。谢谢。
hmohiv<-read.table("http://www.ats.ucla.edu/stat/r/examples/asa/hmohiv.csv", sep=",", header = TRUE)
library(survival)
library(ggplot2)
library(Hmisc)
library(ggfortify)
attach(hmohiv)

hmohiv.surv <- survfit( Surv(time, censor)~ 1)
summary(hmohiv.surv)
autoplot(hmohiv.surv, type = "CI", palette="Set2", pVal=TRUE,
                          title="Recurrence Free Survival",

                          legTitle = "Adjuvant Treatment",
                          xLab="Years to Recurrence", yLab="Probability",
                          censSize = 2,
                          alpha = 0.9,
                          tabTitle = "Number at Risk",
                          tabTitleSize = 14,
                          tabLabSize = 2,
                          nRiskSize = 4,
                          timeTicks = "minor"
) + scale_y_continuous(limits=c(0.5,1))
它运行良好没有
+ scale_y_continuous(limits=c(0.5,1))但是,当我用比例尺运行它时,它会给出以下错误:
自动绘图中的错误(hmohiv.surv,type = "CI",调色板= "Set2",pVal = TRUE,:二进制运算符的非数值参数)
回答 1
Stack Overflow用户
回答已采纳
发布于 2015-11-12 23:13:24
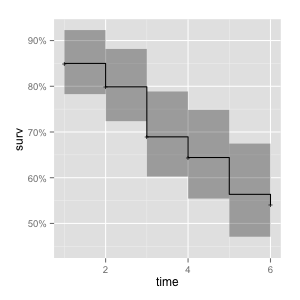
您可以这样做(最好也指定xlim ):
autoplot(hmohiv.surv, ylim = c(0.5, 1.0))

autoplot(hmohiv.surv) + ylim(c(0.5, 1.0))
另一种选择是使用fortify一次将survfit转换为data.frame,然后过滤和绘制。
hmohiv.df <- fortify(hmohiv.surv)
head(hmohiv.df)
#   time n.risk n.event n.censor      surv    std.err     upper     lower
# 1    1    100      15        2 0.8500000 0.04200840 0.9229465 0.7828189
# 2    2     83       5        5 0.7987952 0.05036890 0.8816770 0.7237046
# 3    3     73      10        2 0.6893712 0.06863972 0.7886410 0.6025969
# 4    4     61       4        1 0.6441665 0.07656258 0.7484595 0.5544060
# 5    5     56       7        0 0.5636457 0.09172158 0.6746519 0.4709043
# 6    6     49       2        1 0.5406398 0.09633941 0.6529986 0.4476141

ggfortify:::autoplot.survfit(hmohiv.df[hmohiv.df$surv > 0.5, ])
页面原文内容由Stack Overflow提供。腾讯云小微IT领域专用引擎提供翻译支持
原文链接:
https://stackoverflow.com/questions/33640919
复制相关文章
相似问题
腾讯云开发者

Copyright © 2013 - 2026 Tencent Cloud. All Rights Reserved. 腾讯云 版权所有
深圳市腾讯计算机系统有限公司 ICP备案/许可证号:粤B2-20090059 ![]() 粤公网安备44030502008569号
粤公网安备44030502008569号
腾讯云计算(北京)有限责任公司 京ICP证150476号 | 京ICP备11018762号