
有监督的机器学习,产生一个经过训练的估计器
在一项任务中,我应该使用scikit、numpy和pylab来完成以下任务:
“以下所有内容都应该使用提供的training_data.csv文件中的数据。training_data给出了一组带标签的整数对,表示两个运动队的分数,标签上显示了这项运动。
编写以下函数:
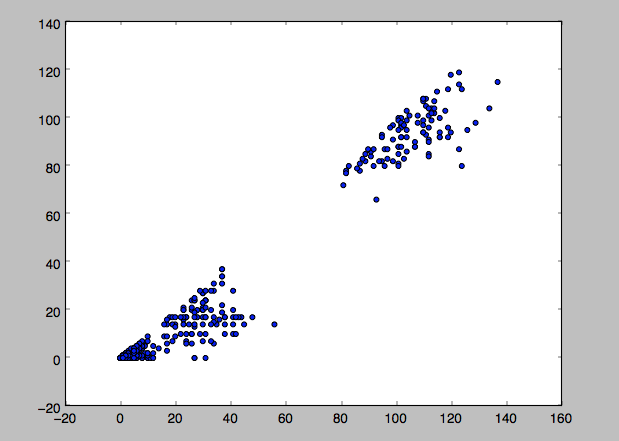
plot_scores()应该绘制数据的散点图。
预测(数据集)应该产生一个经过训练的估计器来猜测导致给定分数的运动(来自我们保留的数据集,它将作为一个1000×2np数组的输入)。你可以使用任何算法从科学工具。
一个名为“预处理”的可选附加函数将在数据集传递到预测之前处理它。“
这就是我到目前为止所做的:
import numpy as np
import scipy as sp
import pylab as pl
from random import shuffle

def plot_scores():
    k=open('training_data.csv')
    lst=[]
    for triple in k:
        temp=triple.split(',')
        lst.append([int(temp[0]), int(temp[1]), int(temp[2][:1])])
    array=np.array(lst)
    pl.scatter(array[:,0], array[:,1])
    pl.show()

def preprocess(dataset):
    k=open('training_data.csv')
    lst=[]
    for triple in k:
        temp=triple.split(',')
        lst.append([int(temp[0]), int(temp[1]), int(temp[2][:1])])
    shuffle(lst)
    return lst
在预处理过程中,我对数据进行了调整,因为我应该使用其中的一些数据进行训练,并对其中的一些数据进行测试,但原始数据并不是随机的。我的问题是,如何在预测(数据集)中“生成一个训练有素的估计器”?这是一个返回另一个函数的函数吗?哪种算法是基于如下数据集进行分类的理想方法:
回答 3
Stack Overflow用户
发布于 2015-11-05 18:52:07
这个任务可能需要您训练一个标准的scikit分类器模型并返回它,例如
from sklearn.svm import SVC
def predict(dataset):
    X = ... # features, extract from dataset
    y = ... # labels, extract from dataset
    clf = SVC() # create classifier
    clf.fit(X, y) # train
return clf尽管从函数(predict)的名称判断,您应该检查它是否真的希望您返回经过训练的分类器或返回给定dataset参数的预测,因为这将是更典型的。
作为一个分类器,你基本上可以使用任何你喜欢的。您的绘图看起来像是您的数据集是线性分离的(类没有颜色,但我假设blops是这两个类)。在线性可分离的数据上,几乎没有什么会失败。尝试SVMs,logistic回归,随机森林,朴素贝叶斯,.为了获得额外的乐趣,您可以尝试绘制决策边界,请参阅这里 (其中还包含可用分类器的概述)。
Stack Overflow用户
发布于 2015-11-05 19:43:38
我建议你看看这个结构:
from random import shuffle
import matplotlib.pyplot as plt
# import a classifier you need


def get_data():
    # open your file and parse data to prepare X as a set of input vectors and Y as a set of targets
    return X, Y


def split_data(X, Y):
    size = len(X)
    indices = range(size)
    shuffle(indices)
    train_indices = indices[:size/2]
    test_indices = indices[size/2:]
    X_train = [X[i] for i in train_indices]
    Y_train = [Y[i] for i in train_indices]
    X_test = [X[i] for i in test_indices]
    Y_test = [Y[i] for i in test_indices]
    return X_train, Y_train, X_test, Y_test


def plot_scatter(Y1, Y2):
    plt.figure()
    plt.scatter(Y1, Y2, 'bo')
    plt.show()


# get data
X, Y = get_data()

# split data
X_train, Y_train, X_test, Y_test = split_data(X, Y)

# create a classifier as an object
classifier = YourImportedClassifier()

# train the classifier, after that the classifier is the trained estimator you need
classifier.train(X_train, Y_train) # or .fit(X_train, Y_train) or another train routine

# make a prediction
Y_prediction = classifier.predict(X_test)

# plot the scatter
plot_scatter(Y_prediction, Y_test)Stack Overflow用户
发布于 2019-07-31 10:26:52
我认为您正在寻找的是clf.fit()函数,而不是创建生成另一个函数的函数。
https://stackoverflow.com/questions/33552182
复制相似问题
腾讯云开发者

Copyright © 2013 - 2026 Tencent Cloud. All Rights Reserved. 腾讯云 版权所有
深圳市腾讯计算机系统有限公司 ICP备案/许可证号:粤B2-20090059 ![]() 粤公网安备44030502008569号
粤公网安备44030502008569号
腾讯云计算(北京)有限责任公司 京ICP证150476号 | 京ICP备11018762号