
如何在CorePlot -Stacked条形图上显示条形图
如何在CorePlot -Stacked条形图上显示条形图
提问于 2015-10-29 05:42:57
我在我的应用程序中使用了core-plot来显示堆叠条形图,我遵循了这个很好的教程来实现堆叠条形图,现在图看起来如下所示。"http://www.gilthonwe.com/2012/06/09/stacked-bar-chart-coreplot-ios/“
我使用下面的代码显示条形图值,同时用户在屏幕上触摸它们。
 -(void)barPlot:(CPTBarPlot *)plot barWasSelectedAtRecordIndex:(NSUInteger)index
    {
        if (plot.isHidden == YES) {
            return;
        }
        static CPTMutableTextStyle *style = nil;
        if (!style) {
            style = [CPTMutableTextStyle textStyle];
            style.color= [CPTColor yellowColor];
            style.fontSize = 16.0f;
            style.fontName = @"Helvetica-Bold";
        }

        NSNumber *price = [NSNumber numberWithDouble:[self doubleForPlot:plot field:CPTBarPlotFieldBarTip recordIndex:index]];
        if (!self.priceAnnotation) {
            NSNumber *x = [NSNumber numberWithInt:0];
            NSNumber *y = [NSNumber numberWithInt:0];
            NSArray *anchorPoint = [NSArray arrayWithObjects:x, y, nil];
            self.priceAnnotation = [[CPTPlotSpaceAnnotation alloc] initWithPlotSpace:plot.plotSpace anchorPlotPoint:anchorPoint];
        }
        static NSNumberFormatter *formatter = nil;
        if (!formatter) {
            formatter = [[NSNumberFormatter alloc] init];
            [formatter setMaximumFractionDigits:2];
        }
        // 5 - Create text layer for annotation
        NSString *priceValue = [formatter stringFromNumber:price];
        CPTTextLayer *textLayer = [[CPTTextLayer alloc] initWithText:priceValue style:style];
        self.priceAnnotation.contentLayer = textLayer;
        NSLog(@"barWasSelectedAtRecordIndex %lu", (unsigned long)index);
        NSInteger plotIndex = 0;
        if ([plot.identifier isEqual:[sets objectForKey:@"Due"]] == YES) {
            plotIndex = 0;
        } else if ([plot.identifier isEqual:[sets objectForKey:@"Overdue"]] == YES) {
            plotIndex = 1;
        } else if ([plot.identifier isEqual:[sets objectForKey:@"Paid"]] == YES) {
            plotIndex = 2;
        }

        CGFloat x =10.00;
        NSNumber *anchorX = [NSNumber numberWithFloat:x];
        CGFloat y = 10.00;
        NSNumber *anchorY = [NSNumber numberWithFloat:y];
        self.priceAnnotation.anchorPlotPoint = [NSArray arrayWithObjects:anchorX, anchorY, nil];
        // 8 - Add the annotation
        [plot.graph.plotAreaFrame.plotArea addAnnotation:self.priceAnnotation];
    }
有关上述代码的响应,请参见图
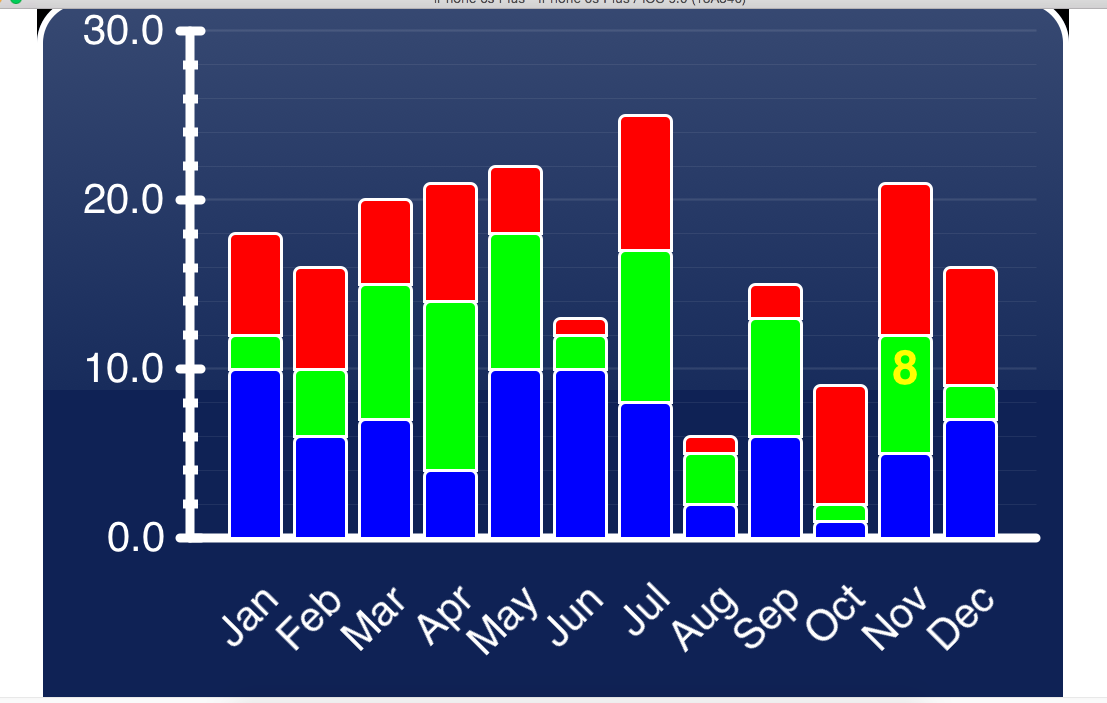
在这里我要面对几个问题
1.这些值不显示在所选条形图上方的确切位置。
- 考虑一下蓝色酒吧value=8,绿吧value=6,红吧value=7
如果单击“蓝色条形图”,将显示该条的确切值。Display Value=8
如果我点击绿条,我将得到蓝条值和绿条值的累积和值。Display Value=14
如果我点击红色条形图,我将得到蓝色、绿色、红色条形图的累积和值。Display Value=21
当用户触摸屏幕上的条形图时,如何在选定的条形图上显示准确的条形图值?
回答 1
Stack Overflow用户
回答已采纳
发布于 2015-10-29 11:49:57
问题中的代码显示所选条形图的“提示”值。在这种情况下,那是酒吧的顶端。如果您想要选定段的长度,则减去条形图的“基”值。
页面原文内容由Stack Overflow提供。腾讯云小微IT领域专用引擎提供翻译支持
原文链接:
https://stackoverflow.com/questions/33406743
复制相关文章
相似问题
腾讯云开发者

Copyright © 2013 - 2026 Tencent Cloud. All Rights Reserved. 腾讯云 版权所有
深圳市腾讯计算机系统有限公司 ICP备案/许可证号:粤B2-20090059 ![]() 粤公网安备44030502008569号
粤公网安备44030502008569号
腾讯云计算(北京)有限责任公司 京ICP证150476号 | 京ICP备11018762号