
如何在R中绘制NA值的多边形?
如何在R中绘制NA值的多边形?
提问于 2015-10-27 15:43:52
我试图用基本图形绘制数据周围的错误区域。我已经想出了如何用多边形来做这件事,但是如果我的数据中有任何NA值,它就会变得非常糟糕。
dat <- rnorm(10, mean = 1:10)
depth <- 11:20
sd <- rnorm(10, mean = 1.5, sd = 0.5)
col <- "blue"
alpha <- .2

col <- adjustcolor(col, alpha.f = alpha)
par(mfrow = c(1,2))
plot(dat, depth, type = "o", main = "No NAs in dat or depth")
x <- c(dat - sd, rev(dat + sd))
y <- c(depth, rev(depth))
polygon(x = x, y = y, col = col, border = NA)

dat[7] <- NA
plot(dat, depth, type = "o", main = "NAs in dat or depth")
x <- c(dat - sd, rev(dat + sd))
y <- c(depth, rev(depth))

polygon(x = x, y = y, col = col, border = NA)
这给了我以下的图像:
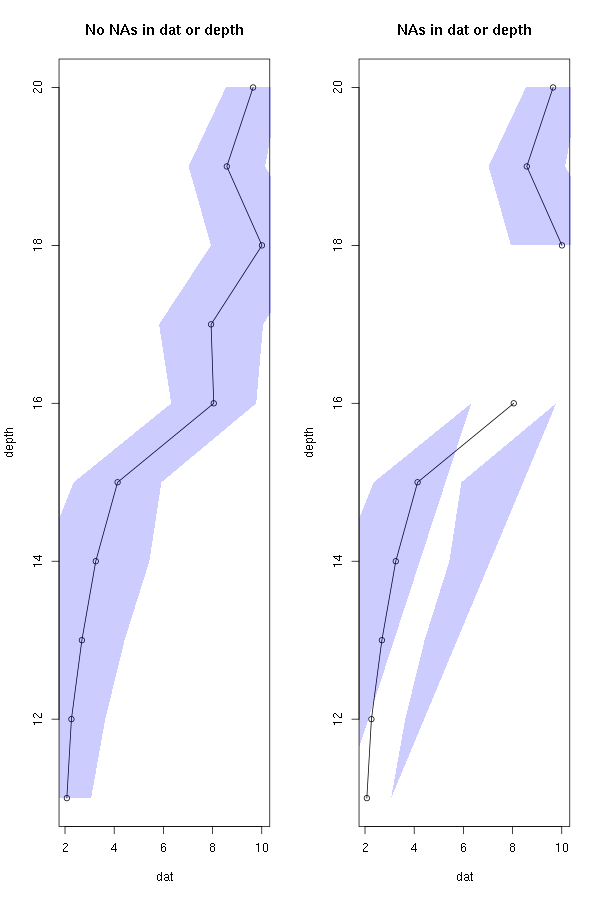
似乎NA值将下多边形划分为两个多边形。我想做的是把它保持为一个多边形。
回答 3
Stack Overflow用户
回答已采纳
发布于 2015-10-27 16:27:46
下面是使用rle函数的一个可能的解决方案:
set.seed(123) # added for reproducibility
dat <- rnorm(10, mean = 1:10)
depth <- 11:20
sd <- rnorm(10, mean = 1.5, sd = 0.5)
col <- "blue"
alpha <- .2

col <- adjustcolor(col, alpha.f = alpha)
par(mfrow = c(1,2))
plot(dat, depth, type = "o", main = "No NAs in dat or depth")
x <- c(dat - sd, rev(dat + sd))
y <- c(depth, rev(depth))
polygon(x = x, y = y, col = col, border = NA)

dat[7] <- NA
plot(dat, depth, type = "o", main = "NAs in dat or depth")
x <- c(dat - sd, rev(dat + sd))
y <- c(depth, rev(depth))

############################################
## code to print error range starts here: ##
############################################
enc <- rle(!is.na(dat))
endIdxs <- cumsum(enc$lengths)
for(i in 1:length(enc$lengths)){
  if(enc$values[i]){
    endIdx <- endIdxs[i]
    startIdx <- endIdx - enc$lengths[i] + 1

    subdat <- dat[startIdx:endIdx]
    subsd <- sd[startIdx:endIdx]
    subdepth <- depth[startIdx:endIdx]

    x <- c(subdat - subsd, rev(subdat + subsd))
    y <- c(subdepth, rev(subdepth))

    polygon(x = x, y = y, col = col, border = NA)
  }
}
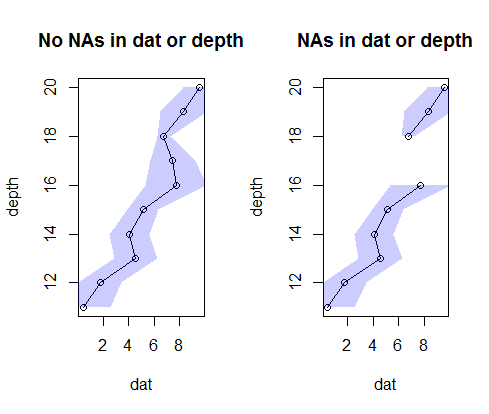
这个想法是为每个连续的非NA块绘制一个多边形。
由于给定一个向量的rle返回具有相同值的连续块的长度和值,所以我们使用它来识别非NA的块,并绘制一个多边形来设置原始的dat、depth和sd向量。
Stack Overflow用户
发布于 2015-10-27 16:32:17
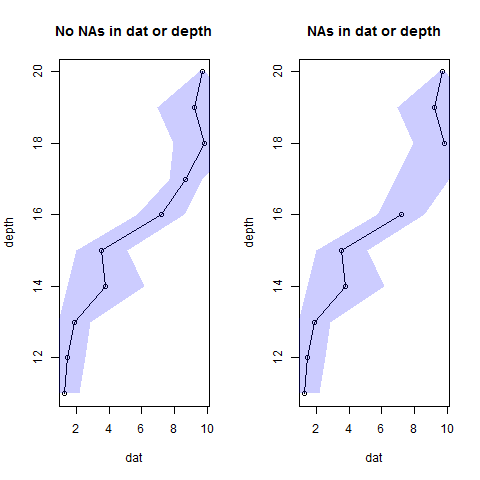
这可以接受吗?
polygon(x = x[!is.na(x)], y = y[!is.na(x)], col = col, border = NA)
Stack Overflow用户
发布于 2015-10-27 16:46:54
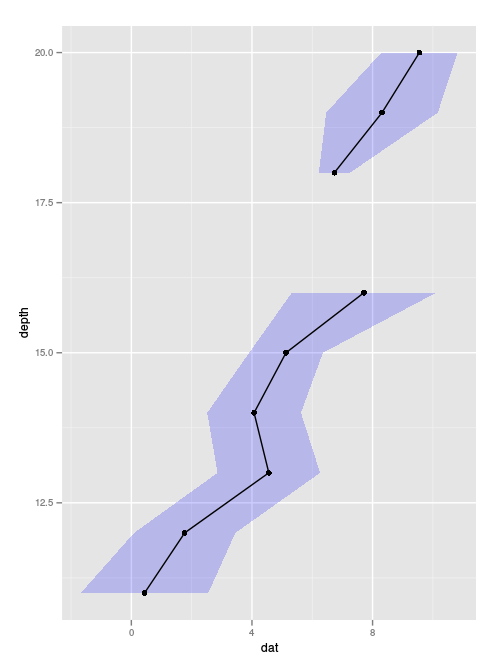
如果您想尝试ggplot2解决方案,下面是如下所示:
将示例数据放入数据框架,并添加低列和高列(在将一个数据点设置为NA之后):
> d=data.frame(dat=dat, depth=depth)
> d$dat[7]=NA
> d$high=d$dat+sd
> d$low=d$dat-sd
然后是一字一句:
> require(ggplot2)
> ggplot(d,aes(x=depth,y=dat)) +
    geom_ribbon(aes(ymax=high,ymin=low),
                fill=adjustcolor("blue",.2) ) +
    geom_line() +
    geom_point() +
    coord_flip()
页面原文内容由Stack Overflow提供。腾讯云小微IT领域专用引擎提供翻译支持
原文链接:
https://stackoverflow.com/questions/33372389
复制相关文章
相似问题
腾讯云开发者

Copyright © 2013 - 2026 Tencent Cloud. All Rights Reserved. 腾讯云 版权所有
深圳市腾讯计算机系统有限公司 ICP备案/许可证号:粤B2-20090059 ![]() 粤公网安备44030502008569号
粤公网安备44030502008569号
腾讯云计算(北京)有限责任公司 京ICP证150476号 | 京ICP备11018762号