
每隔半小时绘制数据
每隔半小时绘制数据
提问于 2015-10-26 13:34:32
我有如下数据:
> operation_time      nb_reaction
> 13.02                  14
> 13.08                  4
> 13.58                  17
> 14.02                  36
> 14.09                  44
> 14.52                  64
> 15.03                  78
我想要绘制这些数据的x=时间和y=nb_reaction,例如,每30分钟分组一次,例如13.02和13.08将包含在同一条中,之后的半小时只包含13.58个小时,之后是14.02和14.09等等。
如何做到这一点?
非常感谢
回答 1
Stack Overflow用户
回答已采纳
发布于 2015-10-26 14:06:02
假设您的两个列都是数字的,您可以这样做:
#this function returns the decimal of a number
decimal <- function(x) {

  decs <- as.numeric(substr(format(x,2), 4,5))
  decs

}
然后,您可以使用上面的函数来绕过时间,如下所示:
#Just an ifelse function to round the time to either .00 or .30
df$round_time <- ifelse(decimal(df$operation_time) < 30,
                        df$operation_time - decimal(df$operation_time) / 100,
                        df$operation_time - decimal(df$operation_time) / 100 + 0.30)
然后,使用以下内容进行聚合:
toplot <- aggregate(nb_reaction ~ round_time, data=df, FUN=sum)最后是阴谋:
barplot(toplot$nb_reaction, names.arg=as.character(toplot$round_time) )
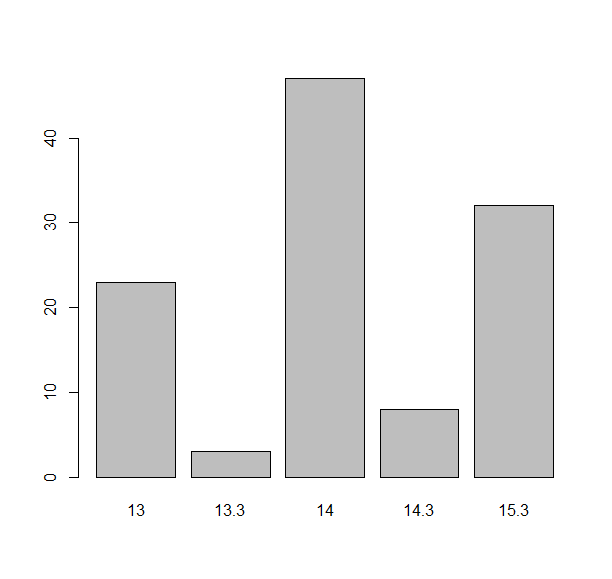
如果你愿意的话,你可以为上面的names.arg提供你自己的标签。
页面原文内容由Stack Overflow提供。腾讯云小微IT领域专用引擎提供翻译支持
原文链接:
https://stackoverflow.com/questions/33347192
复制相关文章
相似问题
腾讯云开发者

Copyright © 2013 - 2026 Tencent Cloud. All Rights Reserved. 腾讯云 版权所有
深圳市腾讯计算机系统有限公司 ICP备案/许可证号:粤B2-20090059  粤公网安备44030502008569号
腾讯云计算(北京)有限责任公司 京ICP证150476号 | 京ICP备11018762号