
X轴标号按向量变化
X轴标号按向量变化
提问于 2015-10-25 14:09:37
大家好,离开一段时间后回来!
我的ATM机出了问题,你可以帮我。
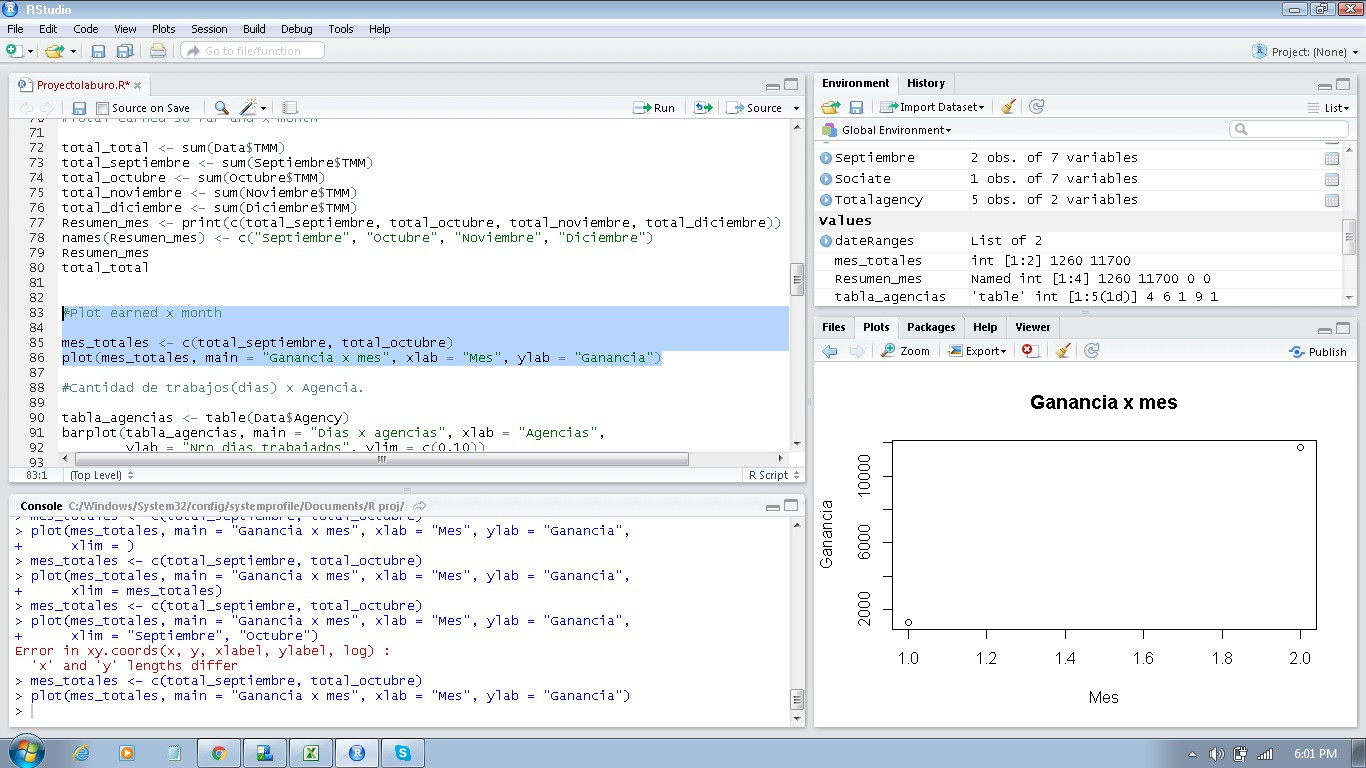
我需要更改X轴索引,而不是显示数字,而是显示月份
这就是我现在所拥有的
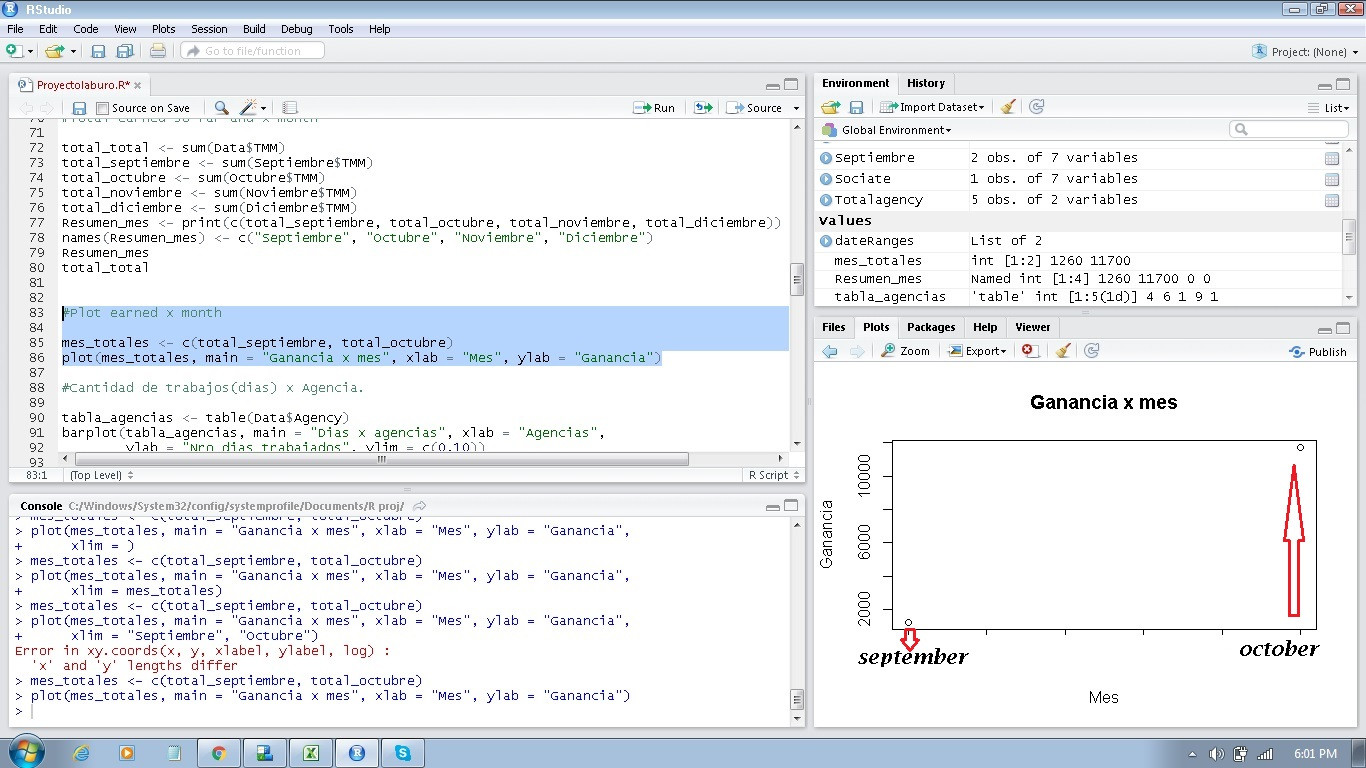
这就是我想要的样子
这是im使用的代码。
mes_totales <- c(total_septiembre, total_octubre)
plot(mes_totales, main = "Ganancia x mes", xlab = "Mes", ylab = "Ganancia")
这是数据。
> print(mes_totales)
[1]  1260 11700
> names(mes_totales) <- c("septiembre", "octubre")
> print(mes_totales)
septiembre    octubre
      1260      11700
谢谢大家!
回答 1
Stack Overflow用户
回答已采纳
发布于 2015-10-25 17:57:40
你可以这样做:
plot(mes_totales, xaxt="n", xlab="Mes", main="Ganancia x mes", ylab="Ganancia")
axis(1, at=1:2, labels=c('"septiembre", "octubre")
将xaxt="n“添加到绘图语句中。它允许您在下一个语句中定义自己的x轴。X轴为1,如果要定义y轴,则使用axis(2.)。对我起作用了。
页面原文内容由Stack Overflow提供。腾讯云小微IT领域专用引擎提供翻译支持
原文链接:
https://stackoverflow.com/questions/33330617
复制相关文章
相似问题
腾讯云开发者

Copyright © 2013 - 2026 Tencent Cloud. All Rights Reserved. 腾讯云 版权所有
深圳市腾讯计算机系统有限公司 ICP备案/许可证号:粤B2-20090059 ![]() 粤公网安备44030502008569号
粤公网安备44030502008569号
腾讯云计算(北京)有限责任公司 京ICP证150476号 | 京ICP备11018762号