
如何测量波峰或低谷之间的周期?
如何测量波峰或低谷之间的周期?
提问于 2015-10-22 04:30:45
我要测量图中所示的相邻波峰值/低点之间的周期,。
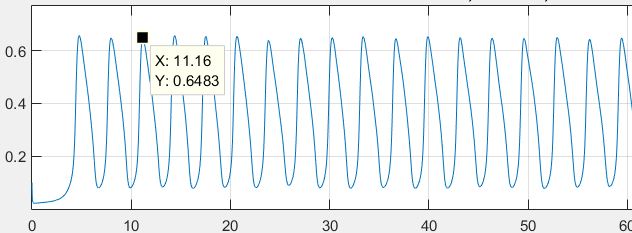
这是细胞内钙浓度的振荡行为。峰值不相同,因此需要计算每个波的峰/低,得到与峰/低相关联的对应时间,求出相邻峰/低之间的差异。每次"0.01“时,我都会存储钙浓度值。
有人能建议我该怎么编码吗?我更喜欢使用较小的代码行。
回答 1
Stack Overflow用户
回答已采纳
发布于 2015-10-22 05:05:15
查看内置的发现峰函数,它可以返回信号中的峰值索引。
你也可以用这个来找出信号中的低值,首先对信号进行平方。这样的东西可以工作(我还没有在MATLAB中尝试过这种方法,因此可能会出现一些语法问题):
% Square the signal so that the lows become peaks
signal = signal .^ 2;

% Get the location of the peaks in terms of t (your time vector)
[~, peaksAndLows] = findpeaks(signal,t)

% Find the difference between consecutive peaks/lows
periodsBetweenPeaksAndLows = diff(peaksAndLows);页面原文内容由Stack Overflow提供。腾讯云小微IT领域专用引擎提供翻译支持
原文链接:
https://stackoverflow.com/questions/33273428
复制相关文章
相似问题
腾讯云开发者

Copyright © 2013 - 2026 Tencent Cloud. All Rights Reserved. 腾讯云 版权所有
深圳市腾讯计算机系统有限公司 ICP备案/许可证号:粤B2-20090059 ![]() 粤公网安备44030502008569号
粤公网安备44030502008569号
腾讯云计算(北京)有限责任公司 京ICP证150476号 | 京ICP备11018762号