
尝试创建动态Dundas Stackedarea图
尝试创建动态Dundas Stackedarea图
提问于 2015-10-19 18:30:49
下午好。我试着研究,但至今还没有找到任何有这方面的例子,我通常不寻求帮助,我只是想出来,但这是我的死亡!我正在动态地创建一个堆叠的区域图,我已经可以创建一个动态的区域图,但是对于我的生活来说,我无法弄清楚如何得到一个堆叠的区域图来堆叠这个系列。我在excel中做了一些类似的事情,我可以让它很好地绘制图表,但是它不是动态的。我有这样的数据:数据是如何编排的
这就是我想要的图表的样子:我想让这个图表看起来怎样
我如何将数据与类别或任何我需要做的事情联系起来?我有一个数组中的数据,但我似乎不知道如何将图表堆栈起来。有人能帮忙吗?如果你需要一些更多的信息,请问,我知道我没有包括我的代码,主要是因为它是非常丑陋和绘制,但可以尝试压缩它一点,如果有人需要简化。
我的代码如下(也许这会有帮助,即使它是丑陋的)
For tmpatozgroup = 1 To 1
            Dim chart1 As New Chart()
            chart1.ID = "chrt-" & tmpatozgroup & "-" & atozser
            Dim seriesperrow As Integer

            Dim chartArea1 As New ChartArea()
            chart1.Height = 340
            chart1.Palette = ChartColorPalette.Dundas
            chart1.BackColor = System.Drawing.Color.LightGray
            chart1.BorderSkin.SkinStyle = BorderSkinStyle.Emboss
            chart1.BorderLineColor = System.Drawing.Color.Gray
            chart1.BorderLineStyle = ChartDashStyle.Solid
            chart1.BorderLineWidth = 4
            ' Set the ChartArea properties
            chartArea1.Name = "Default"
            chartArea1.BackColor = System.Drawing.Color.LightGray
            chartArea1.AxisX.LabelsAutoFit = False
            chartArea1.AxisX.LabelStyle.FontAngle = -45
            chartArea1.Area3DStyle.Enable3D = True
            chart1.ChartAreas.Add(chartArea1)
            Dim series1 As New Series()

            series1.Name = tblGrouping1(tmpatozgroup, 0)
            chart1.Series.Add(series1)
            chart1.Legends.Clear()
            If Not IsNothing(tblGrouping1(tmpatozgroup, 0)) Then
                For tmpatozgroup2 = 1 To 9

                    Dim legend1 As New Legend()
                    Dim sername As String
                    Dim servalues() As Double
                    Dim serformat As String
                    Dim chrtSeriesCnt As Integer

                            sername = tblGrouping1(0, tmpatozgroup2)
                            'need to tear the current row out of the array and place in tmpseries
                            Dim tmpatozcnt As Integer
                            For tmpatozcnt = 1 To 999
                                If IsNothing(tblGrouping1(0, tmpatozcnt)) Then atozseries = tmpatozcnt : Exit For
                                tmpSeries(tmpatozcnt) = tblGrouping1(tmpatozgroup2, tmpatozcnt)
                                chrtSeriesLabels(tmpatozcnt) = tblGrouping1(0, tmpatozcnt)
                            Next
                            servalues = tmpSeries
                            serformat = chrtSeriesForm1


                    chart1.Width = 1000
                    seriesperrow = 1

                    'chart1.AlignDataPointsByAxisLabel()

                    series1.Type = SeriesChartType.StackedColumn
                    series1("StackedGroupName") = "'" & tblGrouping1(tmpatozgroup, 0) & "'"
                    If Not IsNothing(tblGrouping1(tmpatozgroup, 0)) Then

                        For Each ser As Series In chart1.Series

                            For i2 As Integer = 1 To atozseries - 1

                                ser.Points.AddXY(chrtSeriesLabels(i2), servalues(i2 - 1))
                                ser.Points(i2 - 1).BorderColor = Drawing.Color.FromArgb(Split(sercolor(i2), "|")(0), Split(sercolor(i2), "|")(1), Split(sercolor(i2), "|")(2))
                                ser.Points(i2 - 1).Color = Drawing.Color.FromArgb(Split(sercolor(i2), "|")(0), Split(sercolor(i2), "|")(1), Split(sercolor(i2), "|")(2))
                                'ser.XAxisType = AxisType.Secondary

                                Dim tooltipformat As String
                                If serformat = "Currency" Then serformat = "$#,##0.00" : tooltipformat = "{$#,#.00}"
                                If serformat = "###,###,##0.00" Then serformat = "#,##0.00" : tooltipformat = "{#,#}"
                                If serformat = "###,###,##0" Then serformat = "0" : tooltipformat = "{#,#}"
                                ser.Points(i2 - 1).ToolTip = ser.Points(i2 - 1).AxisLabel & " : #VALY" & tooltipformat

                            Next
                            chart1.ChartAreas(0).AxisX.Interval = 1
                            chart1.ChartAreas(0).AxisX.LabelStyle.Interval = 1
                            chart1.ChartAreas(0).AxisX.Title = "test" 'chrtXAxisName
                            chart1.ChartAreas(0).AxisY.Title = sername
                            chart1.ChartAreas(0).AxisY.LabelStyle.Format = serformat
                            chart1.Palette = ChartColorPalette.Dundas
                        Next

                    End If
                Next
                If seriesonrow = seriesperrow Or seriesonrow = 0 Then
                    tr = New TableRow
                    tr.CssClass = "charts column"
                    tr.Style("display") = "none"

                End If
                td = New TableCell
                td.HorizontalAlign = HorizontalAlign.Center
                td.ColumnSpan = 6 / seriesperrow
                td.Controls.Add(chart1)
                tr.Cells.Add(td)
                tblReport.Rows.Add(tr)
                chart1 = Nothing
            End If
        Next
提前谢谢一堆人!后来
回答 1
Stack Overflow用户
回答已采纳
发布于 2015-10-22 13:51:35
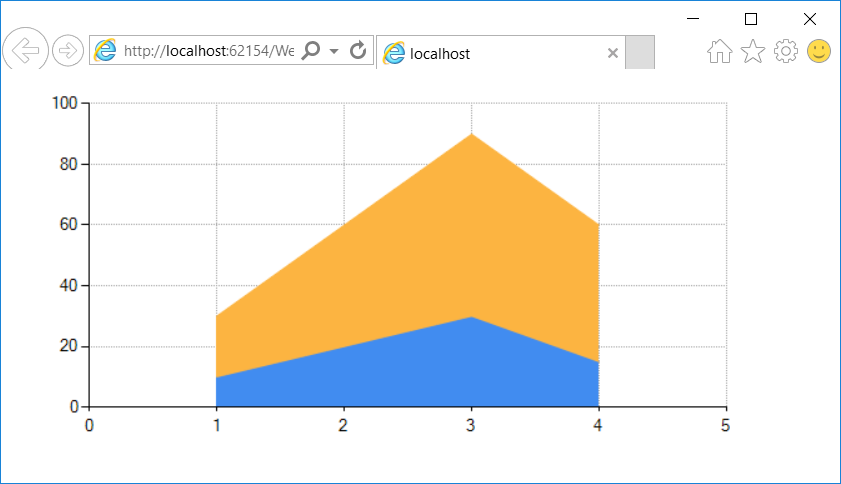
这是一个样本:
    <asp:Chart ID="Chart1" runat="server" Width="600px">
        <Series>
            <asp:Series Name="Series1" ChartType="StackedArea">
                <Points>
                    <asp:DataPoint XValue="1" YValues="10" />
                    <asp:DataPoint XValue="2" YValues="20" />
                    <asp:DataPoint XValue="3" YValues="30" />
                    <asp:DataPoint XValue="4" YValues="15" />
                </Points>
            </asp:Series>
            <asp:Series ChartArea="ChartArea1" ChartType="StackedArea" Name="Series2">
                <Points>
                    <asp:DataPoint XValue="1" YValues="20" />
                    <asp:DataPoint XValue="2" YValues="40" />
                    <asp:DataPoint XValue="3" YValues="60" />
                    <asp:DataPoint XValue="4" YValues="45" />
                </Points>
            </asp:Series>
        </Series>
        <ChartAreas>
            <asp:ChartArea Name="ChartArea1">
                <AxisY>
                    <MajorGrid LineColor="DarkGray" LineDashStyle="Dot" />
                </AxisY>
                <AxisX>
                    <MajorGrid LineColor="DarkGray" LineDashStyle="Dot" />
                </AxisX>
            </asp:ChartArea>
        </ChartAreas>
    </asp:Chart>
编辑:使用代码隐藏:
    protected void Page_Load(object sender, EventArgs e)
    {
        Chart chart1 = new Chart();

        ChartArea area1 = new ChartArea("Area1");

        Series series1 = new Series();
        series1.ChartType = SeriesChartType.StackedArea;
        series1.Points.Add(new DataPoint { XValue = 1, YValues = new double[] { 10 } });
        series1.Points.Add(new DataPoint { XValue = 2, YValues = new double[] { 20 } });
        series1.Points.Add(new DataPoint { XValue = 3, YValues = new double[] { 30 } });
        series1.Points.Add(new DataPoint { XValue = 4, YValues = new double[] { 15 } });
        series1.ChartArea = "Area1";

        Series series2 = new Series();
        series2.ChartType = SeriesChartType.StackedArea;
        series2.Points.Add(new DataPoint { XValue = 1, YValues = new double[] { 20 } });
        series2.Points.Add(new DataPoint { XValue = 2, YValues = new double[] { 40 } });
        series2.Points.Add(new DataPoint { XValue = 3, YValues = new double[] { 60 } });
        series2.Points.Add(new DataPoint { XValue = 4, YValues = new double[] { 45 } });
        series2.ChartArea = "Area1";

        chart1.ChartAreas.Add(area1);
        chart1.Series.Add(series1);
        chart1.Series.Add(series2);

        Controls.Add(chart1);
}编辑2:添加一个图例:
    protected void Page_Load(object sender, EventArgs e)
    {
        Chart chart1 = new Chart();

        ChartArea area1 = new ChartArea("Area1");

        Legend legend1 = new Legend("Legend1");
        legend1.Docking = Docking.Top;
        legend1.Alignment = System.Drawing.StringAlignment.Center;

        Series series1 = new Series("Bought");
        series1.ChartType = SeriesChartType.StackedArea;
        series1.Points.Add(new DataPoint { XValue = 1, YValues = new double[] { 10 } });
        series1.Points.Add(new DataPoint { XValue = 2, YValues = new double[] { 20 } });
        series1.Points.Add(new DataPoint { XValue = 3, YValues = new double[] { 30 } });
        series1.Points.Add(new DataPoint { XValue = 4, YValues = new double[] { 15 } });
        series1.ChartArea = "Area1";
        series1.Legend = "Legend1";

        Series series2 = new Series("Sold");
        series2.ChartType = SeriesChartType.StackedArea;
        series2.Points.Add(new DataPoint { XValue = 1, YValues = new double[] { 20 } });
        series2.Points.Add(new DataPoint { XValue = 2, YValues = new double[] { 40 } });
        series2.Points.Add(new DataPoint { XValue = 3, YValues = new double[] { 60 } });
        series2.Points.Add(new DataPoint { XValue = 4, YValues = new double[] { 45 } });
        series2.ChartArea = "Area1";
        series2.Legend = "Legend1";

        chart1.ChartAreas.Add(area1);
        chart1.Legends.Add(legend1);
        chart1.Series.Add(series1);
        chart1.Series.Add(series2);

        Controls.Add(chart1);
}页面原文内容由Stack Overflow提供。腾讯云小微IT领域专用引擎提供翻译支持
原文链接:
https://stackoverflow.com/questions/33221429
复制相关文章
相似问题
腾讯云开发者

Copyright © 2013 - 2026 Tencent Cloud. All Rights Reserved. 腾讯云 版权所有
深圳市腾讯计算机系统有限公司 ICP备案/许可证号:粤B2-20090059 ![]() 粤公网安备44030502008569号
粤公网安备44030502008569号
腾讯云计算(北京)有限责任公司 京ICP证150476号 | 京ICP备11018762号