
使用ggpairs 2的图例
使用ggpairs 2的图例
提问于 2015-10-04 00:28:00
尽管@MikeWise对this question的回答--我之前问过的答案--使用了示例数据,但它看起来不适用于我的真正代码。
我的代码是:
data(iris)

col.index <- c(1,2,3)

p <- ggpairs(iris, columns = col.index, upper = "blank", legends=T, lower = list(continuous = "points"), diag = "blank",
             axisLabels = "show",
             colour = "Species",
             columnLabels = c("", "", ""),
             title = "Example") +
  theme_bw() +
  theme(plot.title = element_text(size = 10), axis.title = element_text(size = 10), axis.text = element_text(size = 8),
        legend.position = "top", legend.title = element_blank())


p1 <- ggally_text("SL") +
  theme_bw() +
  theme(axis.text = element_blank(), panel.grid = element_blank(), axis.ticks = element_blank())
p2 <- ggally_text("SW") +
  theme_bw() +
  theme(axis.text = element_blank(), panel.grid = element_blank(), axis.ticks = element_blank())
p3 <- ggally_text("PL") +
  theme_bw() +
  theme(axis.text = element_blank(), panel.grid = element_blank(), axis.ticks = element_blank())
p <- putPlot(p,p1,1,1)
p <- putPlot(p,p2,2,2)
p <- putPlot(p,p3,3,3)


GGally:::print_ggpairs_old(p)

colIdx <- c(1,2,3)

for (i in 1:length(colIdx)) {
  # Address only the diagonal elements
  # Get plot out of matrix
  inner <- getPlot(p, i, i);
  # Add any ggplot2 settings you want
  inner <- inner + theme(panel.grid = element_blank()) +
    theme(axis.text.x = element_blank())
  # Put it back into the matrix
  p <- putPlot(p, inner, i, i)

  for (j in 1:length(colIdx)){
    if((i==1 & j==1)){
      inner <- getPlot(p, i, j)
      inner <- inner + theme(legend.position=c(length(colIdx)-0.25,0.50))
      p <- putPlot(p, inner, i, j)
    }
    else{
      inner <- getPlot(p, i, j)
      inner <- inner + theme(legend.position="none")
      p <- putPlot(p, inner, i, j)
    }
  }
}

GGally:::print_ggpairs_old(p)
传说还没有出现。另外,情节不像我想要的那样。使用函数print(),布局将成为我所期望的。
对该怎么做有什么建议吗?
回答 1
Stack Overflow用户
发布于 2015-10-04 08:48:41
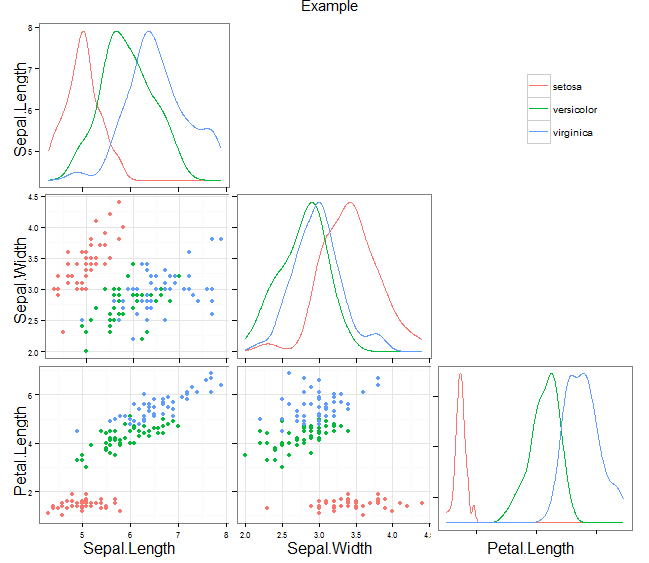
这个有什么问题吗?注意,我更改了diag参数。如果您确实需要空白点,您可以在中编辑它们,在之后调整图例。
library(GGally)
data(iris)

col.index <- c(1,2,3)

p <- ggpairs(iris, columns = col.index,
             upper = "blank", legends=T,
             lower = list(continuous = "points"),
             diag = list(continuous = "density"),
             axisLabels = "show",
             colour = "Species",

             columnLabels = c("", "", ""),
             title = "Example") +
  theme_bw() +
  theme(plot.title = element_text(size = 10),
        axis.title = element_text(size = 10),
        axis.text = element_text(size = 8),
        legend.position = "top",
        legend.title = element_blank())


# p1 <- ggally_text("SL") +
#   theme_bw() +
#   theme(axis.text = element_blank(), panel.grid = element_blank(), axis.ticks = element_blank())
# p2 <- ggally_text("SW") +
#   theme_bw() +
#   theme(axis.text = element_blank(), panel.grid = element_blank(), axis.ticks = element_blank())
# p3 <- ggally_text("PL") +
#   theme_bw() +
#   theme(axis.text = element_blank(), panel.grid = element_blank(), axis.ticks = element_blank())
# p <- putPlot(p,p1,1,1)
# p <- putPlot(p,p2,2,2)
# p <- putPlot(p,p3,3,3)


###THE IT TURNS INTO

GGally:::print_ggpairs_old(p)

colIdx <- c(1,2,3)

for (i in 1:length(colIdx)) {
  # Address only the diagonal elements
  # Get plot out of matrix
  inner <- getPlot(p, i, i);
  # Add any ggplot2 settings you want
  inner <- inner + theme(panel.grid = element_blank()) +
    theme(axis.text.x = element_blank())
  # Put it back into the matrix
  p <- putPlot(p, inner, i, i)

  for (j in 1:length(colIdx)){
    if((i==1 & j==1)){
      inner <- getPlot(p, i, j)
      inner <- inner +
               theme(legend.position=c(length(colIdx)-0.25,0.50))
      p <- putPlot(p, inner, i, j)
    }
    else{
      inner <- getPlot(p, i, j)
      inner <- inner +
               theme(legend.position="none")
      p <- putPlot(p, inner, i, j)
    }
  }
}

GGally:::print_ggpairs_old(p)
页面原文内容由Stack Overflow提供。腾讯云小微IT领域专用引擎提供翻译支持
原文链接:
https://stackoverflow.com/questions/32928854
复制相关文章
相似问题
腾讯云开发者

Copyright © 2013 - 2026 Tencent Cloud. All Rights Reserved. 腾讯云 版权所有
深圳市腾讯计算机系统有限公司 ICP备案/许可证号:粤B2-20090059 ![]() 粤公网安备44030502008569号
粤公网安备44030502008569号
腾讯云计算(北京)有限责任公司 京ICP证150476号 | 京ICP备11018762号