
使用ggpairs对的图例
使用ggpairs对的图例
提问于 2015-10-03 20:56:47
为了遵循这里的示例,我复制了以下代码:
# Load required packages
require(GGally)
# Load datasets
data(state)
df <- data.frame(state.x77,
State = state.name,
Abbrev = state.abb,
Region = state.region,
Division = state.division
)
# Create scatterplot matrix
p <- ggpairs(df,
# Columns to include in the matrix
columns = c(3,5,6,7),
# What to include above diagonal
# list(continuous = "points") to mirror
# "blank" to turn off
upper = "blank",
legends=T,
# What to include below diagonal
lower = list(continuous = "points"),
# What to include in the diagonal
diag = list(continuous = "density"),
# How to label inner plots
# internal, none, show
axisLabels = "none",
# Other aes() parameters
colour = "Region",
title = "State Scatterplot Matrix"
)
# Show the plot
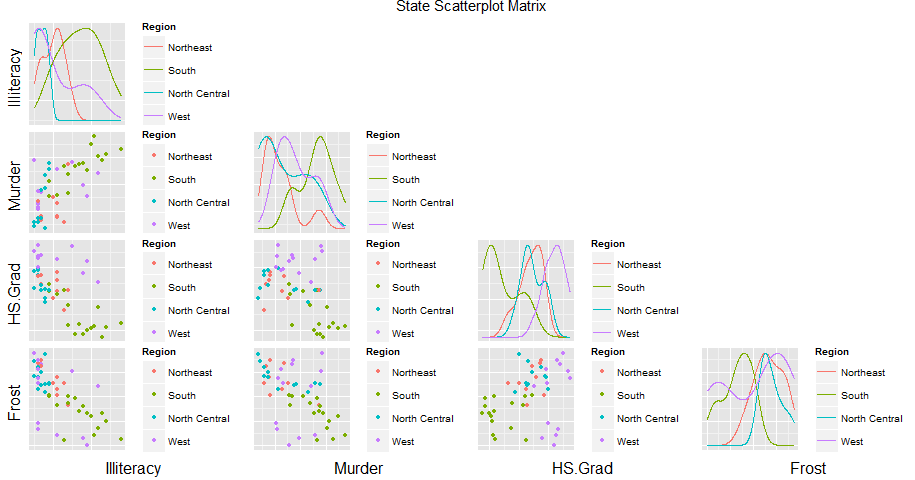
print(p)我应该为每一个情节拍一张有传奇色彩的照片。
但相反,我得到了一个没有任何传奇。
我所得到的图像为什么没有传说?我的案子需要他们!
我使用的是R诉3.2.2,并在RStudio和RGui中都尝试过。
提前感谢!
回答 1
Stack Overflow用户
回答已采纳
发布于 2015-10-03 22:15:34
应该有一个标准的办法,但我找不到。旧的打印功能仍然存在,可以访问,但与内部功能一样。试试这个,而不是打印:
GGally:::print_ggpairs_old(p)
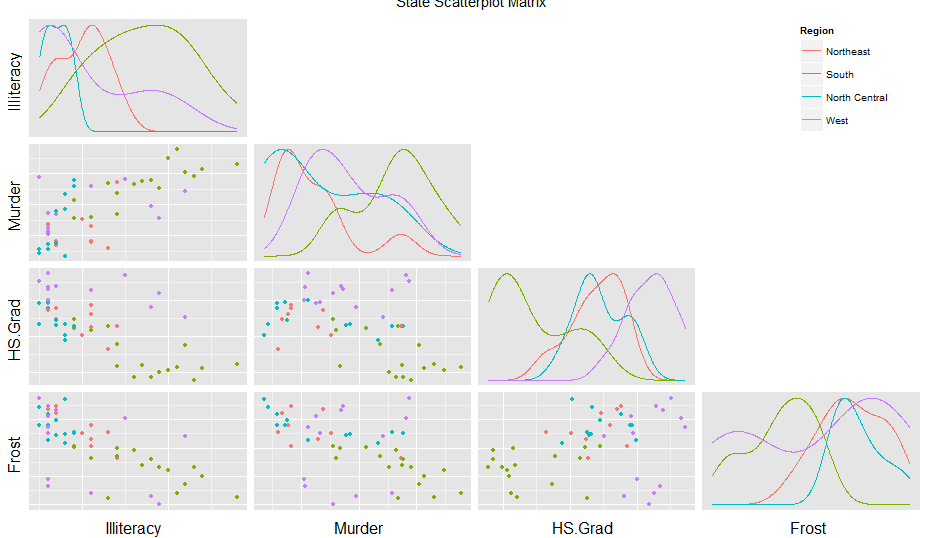
如果你加上这个(感谢这篇文章,答案是Legend using ggpairs )
colidx <- c(3,5,6,7)
for (i in 1:length(colidx)) {

  # Address only the diagonal elements
  # Get plot out of plot-matrix
  inner <- getPlot(p, i, i);

  # Add ggplot2 settings (here we remove gridlines)
  inner <- inner + theme(panel.grid = element_blank()) +
    theme(axis.text.x = element_blank())

  # Put it back into the plot-matrix
  p <- putPlot(p, inner, i, i)

  for (j in 1:length(colidx)){
    if((i==1 & j==1)){

      # Move the upper-left legend to the far right of the plot
      inner <- getPlot(p, i, j)
      inner <- inner + theme(legend.position=c(length(colidx)-0.25,0.50))
      p <- putPlot(p, inner, i, j)
    }
    else{

      # Delete the other legends
      inner <- getPlot(p, i, j)
      inner <- inner + theme(legend.position="none")
      p <- putPlot(p, inner, i, j)
    }
  }
}
你会得到更好的东西:
页面原文内容由Stack Overflow提供。腾讯云小微IT领域专用引擎提供翻译支持
原文链接:
https://stackoverflow.com/questions/32927426
复制相关文章
相似问题
腾讯云开发者

Copyright © 2013 - 2026 Tencent Cloud. All Rights Reserved. 腾讯云 版权所有
深圳市腾讯计算机系统有限公司 ICP备案/许可证号:粤B2-20090059 ![]() 粤公网安备44030502008569号
粤公网安备44030502008569号
腾讯云计算(北京)有限责任公司 京ICP证150476号 | 京ICP备11018762号