
格图细胞间平铺线
格图细胞间平铺线
提问于 2015-09-19 07:15:30
我正在使用ggplot和geom_tile来形成热图。我想在细胞间插入一些模糊的线条。
例如:
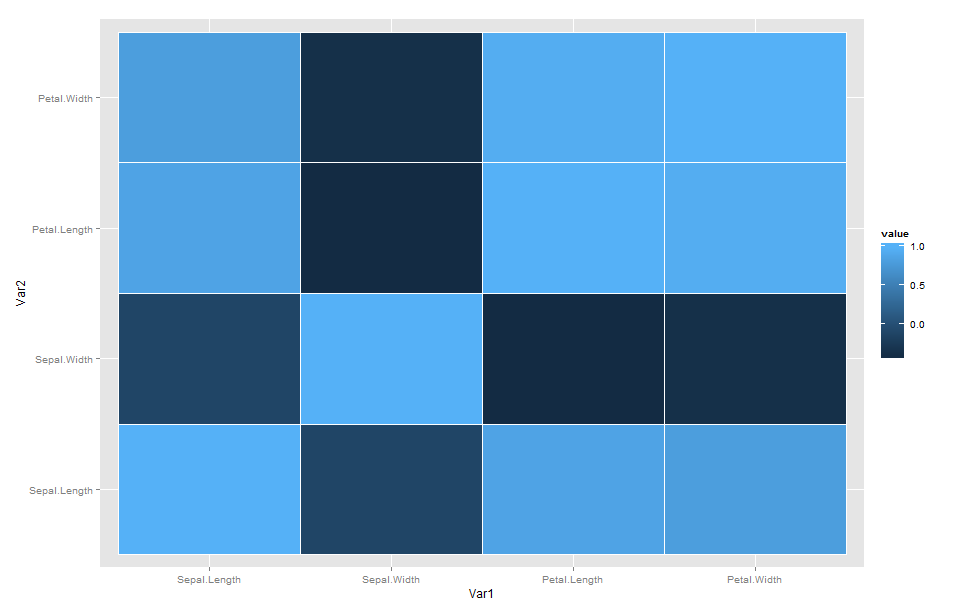
我的ggplot geom_tile热图:
library(ggplot2)
library(reshape2)
data("iris")
x = melt(cor(iris[,1:4]))
ggplot(data=x,aes(Var1,Var2,fill=value)) + geom_tile() # No line between the cells
我想要的(来自R中的d3heatmap包)
library(d3heatmap)
data("iris")
x = cor(iris[,1:4])
d3heatmap(cor(iris[,1:4]),Rowv = F,Colv = F) #There is a faint line between the cells
(抱歉不能发任何照片)谢谢!
回答 1
Stack Overflow用户
回答已采纳
发布于 2015-09-19 10:36:09
只需将color = "gray"添加到geom_tile
library(ggplot2)
library(reshape2)
data("iris")
x = melt(cor(iris[,1:4]))
ggplot(data=x,aes(Var1,Var2,fill=value)) +
  geom_tile(color = "gray")
将给出在瓷砖之间有线条的数字:
您可以使用size使线条更大或更小,并/或使用color = white。
页面原文内容由Stack Overflow提供。腾讯云小微IT领域专用引擎提供翻译支持
原文链接:
https://stackoverflow.com/questions/32665431
复制相关文章
相似问题
腾讯云开发者

Copyright © 2013 - 2026 Tencent Cloud. All Rights Reserved. 腾讯云 版权所有
深圳市腾讯计算机系统有限公司 ICP备案/许可证号:粤B2-20090059 ![]() 粤公网安备44030502008569号
粤公网安备44030502008569号
腾讯云计算(北京)有限责任公司 京ICP证150476号 | 京ICP备11018762号