
JavaFX线状色差
JavaFX线状色差
提问于 2015-09-16 06:19:01
我在JavaFx中有一个有两条线的线图,我想给这两条线之间的空间着色。我在网上搜索,但什么也没找到。这就是我所拥有的:
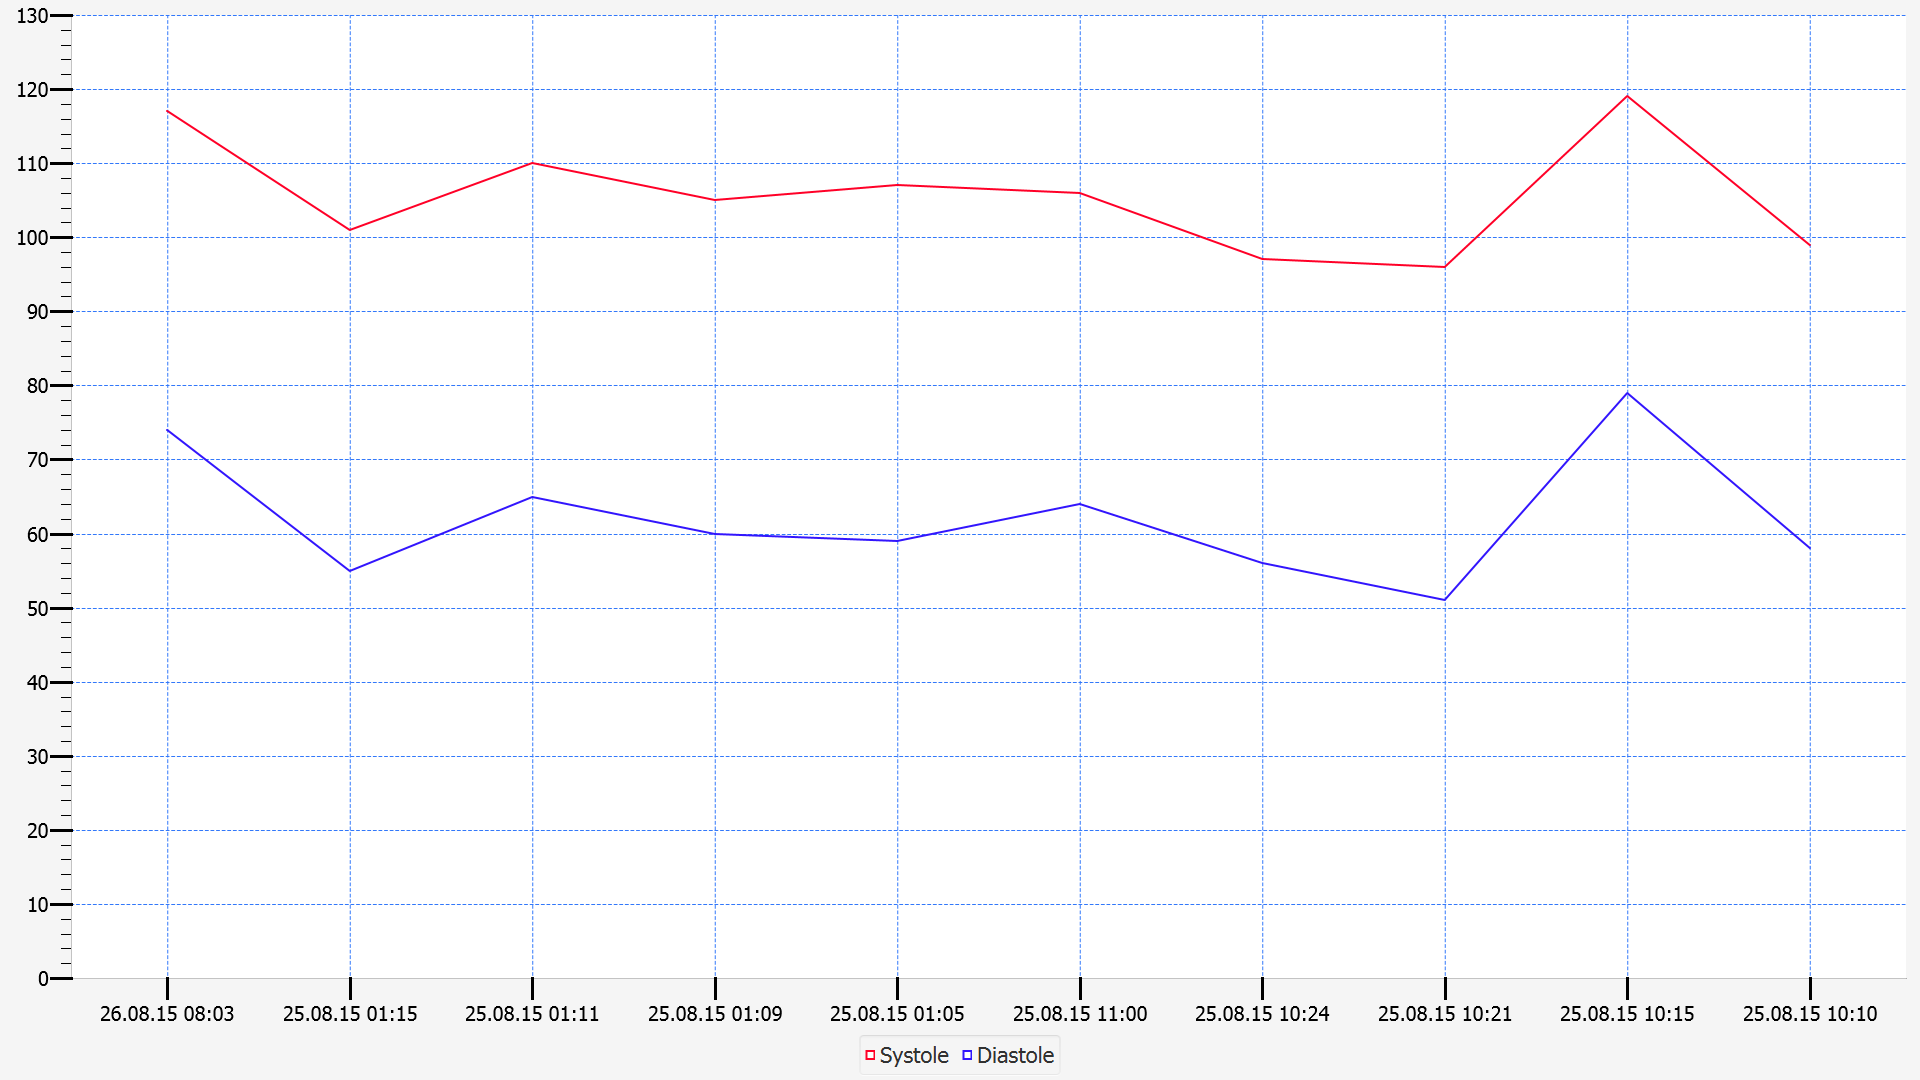
我想让它看起来像
回答 1
Stack Overflow用户
回答已采纳
发布于 2015-09-16 13:23:02
多亏了NwDx的评论,我才能解决我的问题。
我这样高估了layoutPlotChildren() of Chart:
super.layoutPlotChildren();
XYChart.Series s = (XYChart.Series) getData().get(0);
XYChart.Series d = (XYChart.Series) getData().get(1);
ObservableList<XYChart.Data<X,Y>> systole = s.getData();
ObservableList<XYChart.Data<X,Y>> diastole = d.getData();
for(int i = 0; i < systole.size()-1; i++)
{
XYChart.Data SysPoint = systole.get(i);
XYChart.Data DiasPoint = diastole.get(i);
double x = getXAxis().getDisplayPosition(SysPoint.getXValue().toString());
double y = getYAxis().getDisplayPosition(DiasPoint.getYValue());
double x2 = getXAxis().getDisplayPosition(systole.get((i+1)).getXValue().toString());
double y2 = getYAxis().getDisplayPosition(diastole.get((i+1)).getYValue());
Polygon polygon = new Polygon();
LinearGradient linearGrad = new LinearGradient(
0, // start X
0, // start Y
0, // end X
1, // end Y
true, // proportional
CycleMethod.NO_CYCLE, // cycle colors
// stops
new Stop(0.1f, Color.rgb(255, 0, 0, .3)),
new Stop(0.5f, Color.rgb(127, 0, 127, .3)),
new Stop(1.0f, Color.rgb(0, 0, 255, .3)));
polygon.getPoints().addAll(new Double[]{
x,y,
x, getYAxis().getDisplayPosition(SysPoint.getYValue()),
x2,getYAxis().getDisplayPosition(systole.get((i+1)).getYValue()),
x2,y2
});
getPlotChildren().add(polygon);
polygon.toFront();
polygon.setFill(linearGrad);
}
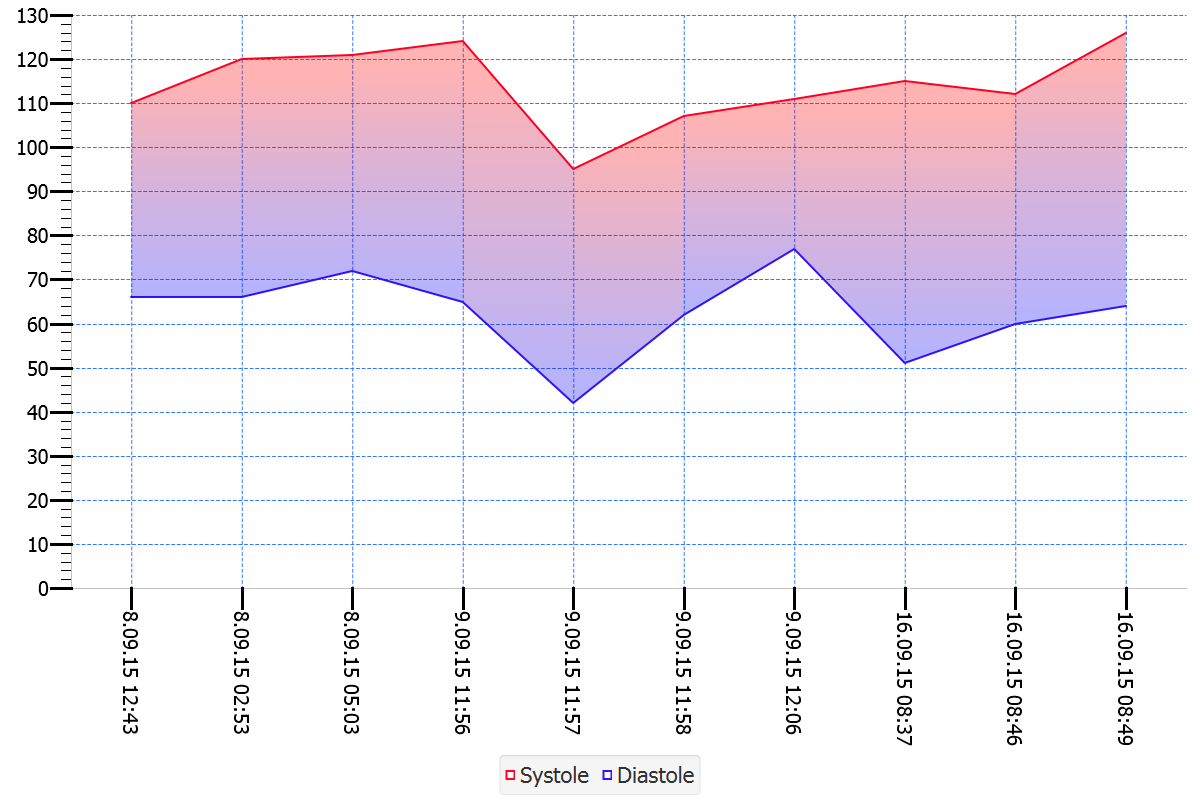
}我创建了一个多边形,将两个缩孔和两个Diastole点连接起来,并用一个LinearGradient填充它们。
我的图表现在看起来如下:
页面原文内容由Stack Overflow提供。腾讯云小微IT领域专用引擎提供翻译支持
原文链接:
https://stackoverflow.com/questions/32601082
复制相关文章
相似问题
腾讯云开发者

Copyright © 2013 - 2026 Tencent Cloud. All Rights Reserved. 腾讯云 版权所有
深圳市腾讯计算机系统有限公司 ICP备案/许可证号:粤B2-20090059 ![]() 粤公网安备44030502008569号
粤公网安备44030502008569号
腾讯云计算(北京)有限责任公司 京ICP证150476号 | 京ICP备11018762号