
水平桶形图和平均值(表)
水平桶形图和平均值(表)
提问于 2015-09-08 15:16:56
所以我有这个数据向量,它代表平均:
a1<-c(5.0, 4.0, 7.0, 5.3, 3.5)
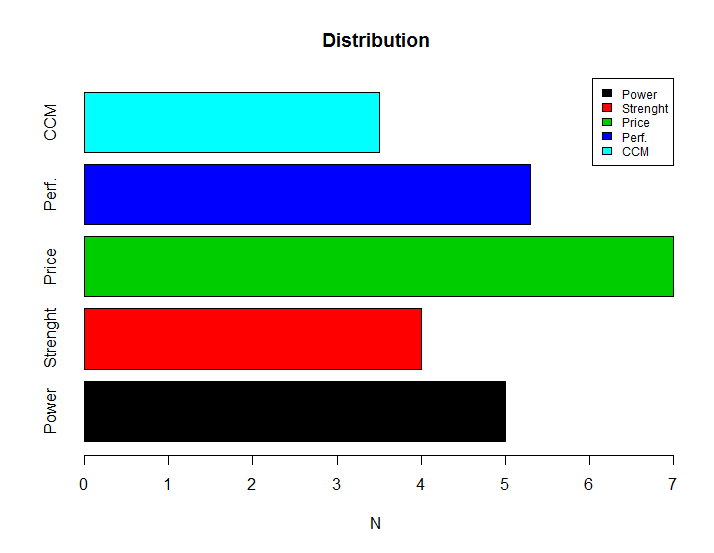
names(a1)<-c(as.character(c("Power", "Strenght", "Price", "Perf.", "CCM")))而这个代码可以生成barplot
barplot(a1, main="Distribution",
        xlab="N", col=1:5,horiz=TRUE)
        legend("topright",
        legend = names(a1),
        fill = 1:5,
        cex = 0.75)
我的结果是
现在,我想知道是否有一种方法,可以编辑我的R代码并将其作为我的输出:
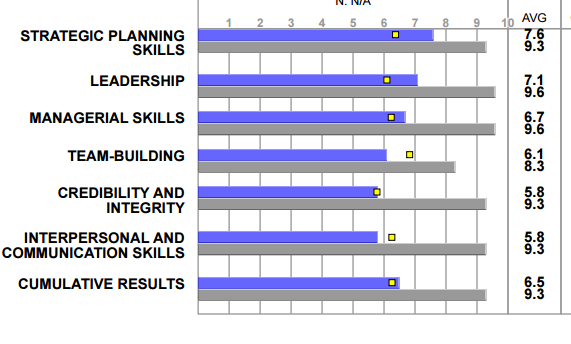
上面的图片是我在网上找到的一份报告的打印屏幕。因此,我想创建这些(或类似的)地块和平均值表,例如,战略规划技能将呈现CCM和诸如此类的堡垒?
回答 1
Stack Overflow用户
回答已采纳
发布于 2015-09-08 15:42:21
像这样吗?
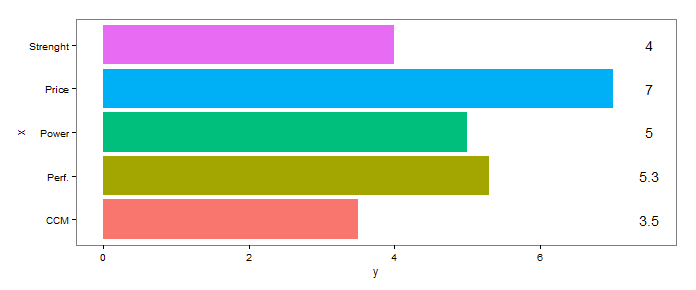
df <- data.frame(x=names(a1), y=a1)
library(ggplot2)
ggplot(df, aes(x,y, fill=x)) + geom_bar(stat="identity")+ coord_flip()+
geom_text(aes(y=max(y)+0.5, label=y), color="black")+
scale_fill_discrete(guide="none")+
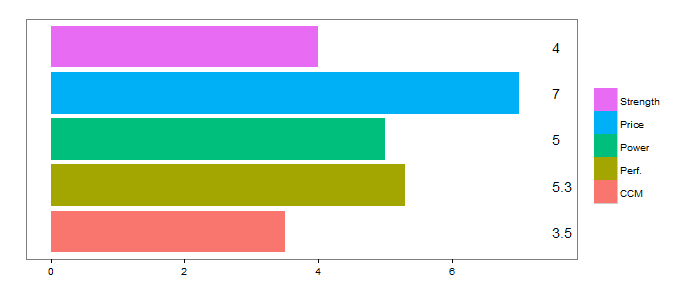
theme_bw()+theme(panel.grid=element_blank())编辑:对OP的评论的回应。
ggplot(df, aes(x,y, fill=x)) + geom_bar(stat="identity")+ coord_flip()+
  geom_text(aes(y=max(y)+0.5, label=y), color="black", hjust=0)+
  scale_fill_discrete(name="", guide=guide_legend(reverse=TRUE))+
  theme_bw()+
  theme(panel.grid=element_blank(), axis.title=element_blank(),
        axis.text.y=element_blank(), axis.ticks.y=element_blank())
页面原文内容由Stack Overflow提供。腾讯云小微IT领域专用引擎提供翻译支持
原文链接:
https://stackoverflow.com/questions/32461474
复制相关文章
相似问题
腾讯云开发者

Copyright © 2013 - 2026 Tencent Cloud. All Rights Reserved. 腾讯云 版权所有
深圳市腾讯计算机系统有限公司 ICP备案/许可证号:粤B2-20090059 ![]() 粤公网安备44030502008569号
粤公网安备44030502008569号
腾讯云计算(北京)有限责任公司 京ICP证150476号 | 京ICP备11018762号