
dotPlot没有正确显示点颜色
dotPlot没有正确显示点颜色
提问于 2015-09-02 22:13:54
我有一个点图,我想给点着色,所以我有一个d$color向量,它对应于特定点的颜色。
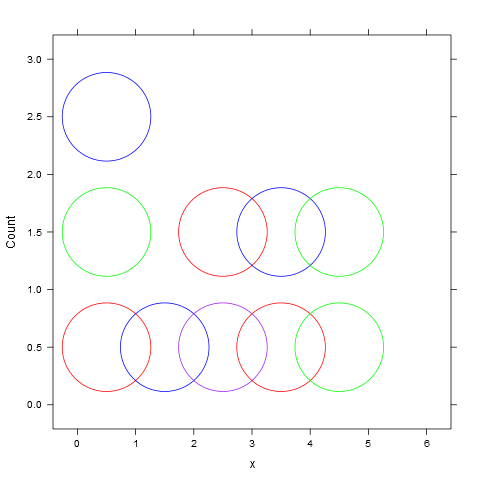
问题1:当您运行下面的代码时,您可以看到点没有正确地着色吗?你知道怎么把它们涂好吗?代码需要动态处理颜色变化的情况。例如,在这种情况下,“红色”是第一个颜色,但情况并不总是如此。
问题2:你也知道如何使点填充而不是透明吗?
library(mosaic)
binwidth <- 1
dat <- c(1, 1, 1, 2, 3, 3, 4, 4, 5, 5)
d <- data.frame(x=dat, color=c("red", "green", "blue", "blue", "purple", "red",
                               "red", "blue", "green", "green"))
dotPlot(~x, data=d, groups=color,
        breaks=seq(min(d$x) - binwidth, max(d$x) + binwidth, binwidth),
        cex=1, col=as.factor(d$color))
问题3:你能运行这段代码吗?孤子在这里似乎不起作用:
n=50
r =rnorm(n)
dat = sample(r ,n= 1,size = n, replace = TRUE)
d = data.frame( x = dat, color = c(rep("red",n/2), rep("green",n/2)))
dotPlot(d$x,  breaks = seq(min(d$x)-.1,max(d$x)+.1,.1)) # this works
dotPlot(d$x, breaks = seq(min(d$x)-.1,max(d$x)+.1,.1), groups = color,col = levels(d$color) ) # this does not work回答 2
Stack Overflow用户
回答已采纳
发布于 2015-09-02 22:41:49
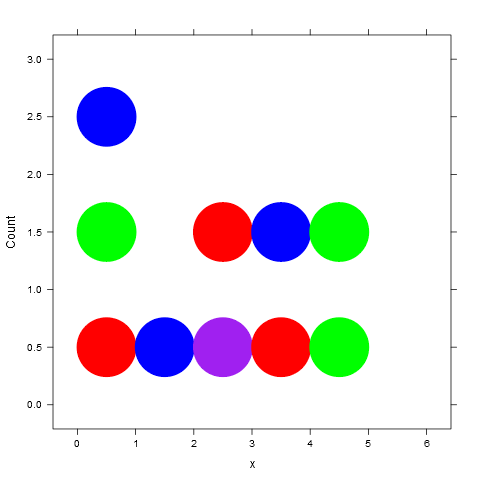
若要按需要对点着色,请传递一个颜色矢量,该矢量对应于您所希望的组颜色(因此,这里是4种颜色的矢量,而不是10种颜色的向量)。
dotPlot(~x, data=d, groups=color, col=levels(d$color),
        breaks=seq(min(d$x) - binwidth, max(d$x) + binwidth, binwidth))
若要更改符号,请使用pch (有关内置绘图字符的列表,请参见?pch )。
dotPlot(~x, data=d, groups=color, col=levels(d$color), pch=20,
        breaks=seq(min(d$x) - binwidth, max(d$x) + binwidth, binwidth))
Stack Overflow用户
发布于 2015-09-02 22:40:33
对于Q2,只需在默认情况下用参数"pch“更改"point”的类型。
dotPlot(~x, data=d, groups = color, breaks = seq(min(d$x)-binwidth, max(d$x)+binwidth,binwidth), cex = 1, col = d$color, pch = 16)页面原文内容由Stack Overflow提供。腾讯云小微IT领域专用引擎提供翻译支持
原文链接:
https://stackoverflow.com/questions/32364020
复制相关文章
相似问题
腾讯云开发者

Copyright © 2013 - 2026 Tencent Cloud. All Rights Reserved. 腾讯云 版权所有
深圳市腾讯计算机系统有限公司 ICP备案/许可证号:粤B2-20090059 ![]() 粤公网安备44030502008569号
粤公网安备44030502008569号
腾讯云计算(北京)有限责任公司 京ICP证150476号 | 京ICP备11018762号