
用cartopy和matplotlib.tri绘制三角形网格
我试图用cartopy和matplotlib.tri绘制一个三角网格。我使用一个matplotlib.tri.Triangulation对象,并希望用matplotlib.pyplot.triplot绘制它。
当我将cartopy投影作为用transform=projection转换到triplot的时候,就像绘制一条线一样,并不是所有的三角形都是画出来的,当我试图保存这个图形时,我得到了一个IndexError。
另一方面,当我手动转换三角剖分中的所有点,并调用Tri图时,它就能工作了。
在下面的第一个示例中,绘制了所有三角形,Line2D对象没有不同。但是,试图保存这个数字会引发IndexError。
在第二个示例中,使用Line2D和手动转换后生成的triplot对象在应用于数据的转换结果上存在差异。所以也许这是一个组合变换的顺序问题。
注:我选择PlateCarree是为了让它尽可能简单。在轴和数据投影的其他组合中,我也有同样的问题。
import matplotlib.pyplot as plt
import numpy as np
from cartopy.crs import PlateCarree
from matplotlib.tri import Triangulation

plt.interactive(False)

# NB. plt.triplot returns a list of two Line2D objects in both cases
# the second of which is empty, therefore only the first is returned

def triplot_with_transform(triangulation):
    """
    triangulation: matplotlib.tri.Triangulation

    """
    plt.figure()
    plt.subplot(projection=PlateCarree())
    lines = plt.triplot(triangulation, transform=PlateCarree())
    return plt.gcf(), lines[0]


def transform_before_triplot(triangulation):
    """
    triangulation: matplotlib.tri.Triangulation

    """
    plt.figure()
    plt.subplot(projection=PlateCarree())
    [x_tr, y_tr, _] = PlateCarree().transform_points(PlateCarree(),
                                                     triangulation.x,
                                                     triangulation.y).T
    triangulation_tr = Triangulation(x_tr, y_tr, triangulation.triangles)
    lines = plt.triplot(triangulation_tr)
    return plt.gcf(), lines[0]


def compare_line2d(line1, line2):
    """
    line1, line2 : matplotlib.lines.Line2D

    """
    data1 = line1.get_xydata()
    transform1 = line1.get_transform()
    data2 = line2.get_xydata()
    transform2 = line2.get_transform()
    data1_ma = np.ma.masked_invalid(data1)
    data2_ma = np.ma.masked_invalid(data2)
    data1_tr = transform1.transform(data1)
    data2_tr = transform2.transform(data2)
    data1_tr_ma = np.ma.masked_invalid(data1_tr)
    data2_tr_ma = np.ma.masked_invalid(data2_tr)

    print 'NaNs in line data match ', np.all(data1_ma.mask == data2_ma.mask)
    print 'Line data mismatch', abs(data1_ma-data2_ma).max()

    print 'NaNs in transformed line data match ', np.all(data1_tr_ma.mask ==
                                                         data2_tr_ma.mask)
    print 'Transformed line data mismatch', abs(data1_tr_ma-data2_tr_ma).max()


def try_so_save(fig):
    try:
        fig.savefig('triangulation.pdf')
    except Exception as e:
        print "Exception while saving figure\n", e.__repr__()


# First example, 100 vertices.
x, y = np.meshgrid(np.arange(0, 50, 5), np.arange(0, 50, 5))
tri = Triangulation(x.ravel(), y.ravel())
fig1, line1 = triplot_with_transform(tri)
fig2, line2 = transform_before_triplot(tri)

# Second example, 2500 vertices.
x, y = np.meshgrid(np.arange(0, 50), np.arange(0, 50))
tri = Triangulation(x.ravel(), y.ravel())
fig3, line3 = triplot_with_transform(tri)
fig4, line4 = transform_before_triplot(tri)

# Compare Line2D objects; since we transform from PlateCarree to
# PlateCarree, the lines should be (almost) equal.
print "Line2D objects from first example"
compare_line2d(line1, line2)
print "Line2D objects from second example"
compare_line2d(line3, line4)

# Try to save the figures.
print "Save fig1 from first example."
try_so_save(fig1)
print "Save fig3 from second example."
try_so_save(fig3)

# failing plt.savefig command to produce full traceback
fig1.savefig('triangulation.pdf')
输出是
Line2D objects from first example
NaNs in line data match  True
Line data mismatch 3.5527136788e-15
NaNs in transformed line data match  True
Transformed line data mismatch 0.0
Line2D objects from second example
NaNs in line data match  True
Line data mismatch 7.1054273576e-15
NaNs in transformed line data match  True
Transformed line data mismatch 3545.955
Save fig1 from first example.
Exception while saving figure
IndexError('Out of bounds on buffer access (axis 0)',)
Save fig3 from second example.
Exception while saving figure
IndexError('Out of bounds on buffer access (axis 0)',)当试图保存用transform=projection创建的任何图形时,cartopy._crs.CRS.transform_points会引发IndexError。
这是卡拉托还是matplotlib.tri的问题?是否有一种方法可以避免手动转换,并将transform参数传递给triplot?
编辑:
在pp-mo的回答之后,我发现将一个带有标记(如'o-' )的格式字符串添加到that命令中,可以使其工作。不过,仅仅改变颜色('g-)是没有帮助的。
编辑2:
在示例代码中添加了fig1.savefig以生成完整的跟踪。
回答 1
Stack Overflow用户
发布于 2015-09-02 17:50:58
我试过了,但力学上似乎没有什么根本问题。下面是一个简单的工作例子..。
"""
Example shamelessly poached from http://matplotlib.org/mpl_examples/pylab_examples/triplot_demo.py

We just add a mapping transform to the second figure there...

"""
import matplotlib.pyplot as plt
import matplotlib.tri as tri
import numpy as np
import math

import cartopy.crs as ccrs

# Some points defining a triangulation over (roughly) Britain.
xy = np.asarray([
    [-0.101, 0.872], [-0.080, 0.883], [-0.069, 0.888], [-0.054, 0.890],
    [-0.045, 0.897], [-0.057, 0.895], [-0.073, 0.900], [-0.087, 0.898],
    [-0.090, 0.904], [-0.069, 0.907], [-0.069, 0.921], [-0.080, 0.919],
    [-0.073, 0.928], [-0.052, 0.930], [-0.048, 0.942], [-0.062, 0.949],
    [-0.054, 0.958], [-0.069, 0.954], [-0.087, 0.952], [-0.087, 0.959],
    [-0.080, 0.966], [-0.085, 0.973], [-0.087, 0.965], [-0.097, 0.965],
    [-0.097, 0.975], [-0.092, 0.984], [-0.101, 0.980], [-0.108, 0.980],
    [-0.104, 0.987], [-0.102, 0.993], [-0.115, 1.001], [-0.099, 0.996],
    [-0.101, 1.007], [-0.090, 1.010], [-0.087, 1.021], [-0.069, 1.021],
    [-0.052, 1.022], [-0.052, 1.017], [-0.069, 1.010], [-0.064, 1.005],
    [-0.048, 1.005], [-0.031, 1.005], [-0.031, 0.996], [-0.040, 0.987],
    [-0.045, 0.980], [-0.052, 0.975], [-0.040, 0.973], [-0.026, 0.968],
    [-0.020, 0.954], [-0.006, 0.947], [ 0.003, 0.935], [ 0.006, 0.926],
    [ 0.005, 0.921], [ 0.022, 0.923], [ 0.033, 0.912], [ 0.029, 0.905],
    [ 0.017, 0.900], [ 0.012, 0.895], [ 0.027, 0.893], [ 0.019, 0.886],
    [ 0.001, 0.883], [-0.012, 0.884], [-0.029, 0.883], [-0.038, 0.879],
    [-0.057, 0.881], [-0.062, 0.876], [-0.078, 0.876], [-0.087, 0.872],
    [-0.030, 0.907], [-0.007, 0.905], [-0.057, 0.916], [-0.025, 0.933],
    [-0.077, 0.990], [-0.059, 0.993]])
# Make lats + lons
x = xy[:, 0]*180/3.14159
y = xy[:, 1]*180/3.14159

# A selected triangulation of the points.
triangles = np.asarray([
    [67, 66,  1], [65,  2, 66], [ 1, 66,  2], [64,  2, 65], [63,  3, 64],
    [60, 59, 57], [ 2, 64,  3], [ 3, 63,  4], [ 0, 67,  1], [62,  4, 63],
    [57, 59, 56], [59, 58, 56], [61, 60, 69], [57, 69, 60], [ 4, 62, 68],
    [ 6,  5,  9], [61, 68, 62], [69, 68, 61], [ 9,  5, 70], [ 6,  8,  7],
    [ 4, 70,  5], [ 8,  6,  9], [56, 69, 57], [69, 56, 52], [70, 10,  9],
    [54, 53, 55], [56, 55, 53], [68, 70,  4], [52, 56, 53], [11, 10, 12],
    [69, 71, 68], [68, 13, 70], [10, 70, 13], [51, 50, 52], [13, 68, 71],
    [52, 71, 69], [12, 10, 13], [71, 52, 50], [71, 14, 13], [50, 49, 71],
    [49, 48, 71], [14, 16, 15], [14, 71, 48], [17, 19, 18], [17, 20, 19],
    [48, 16, 14], [48, 47, 16], [47, 46, 16], [16, 46, 45], [23, 22, 24],
    [21, 24, 22], [17, 16, 45], [20, 17, 45], [21, 25, 24], [27, 26, 28],
    [20, 72, 21], [25, 21, 72], [45, 72, 20], [25, 28, 26], [44, 73, 45],
    [72, 45, 73], [28, 25, 29], [29, 25, 31], [43, 73, 44], [73, 43, 40],
    [72, 73, 39], [72, 31, 25], [42, 40, 43], [31, 30, 29], [39, 73, 40],
    [42, 41, 40], [72, 33, 31], [32, 31, 33], [39, 38, 72], [33, 72, 38],
    [33, 38, 34], [37, 35, 38], [34, 38, 35], [35, 37, 36]])

# Make a triangulation object
my_tris = tri.Triangulation(x, y, triangles)

# Plot over an OSGB map with a coastline.
crs_pc = ccrs.PlateCarree()
crs_uk = ccrs.OSGB()
plt.figure()
ax = plt.axes(projection=crs_uk)
ax.coastlines(color='red', linewidth=1.5)
plt.triplot(my_tris,
            'go-',
            transform=ccrs.PlateCarree())
plt.show()
输出:
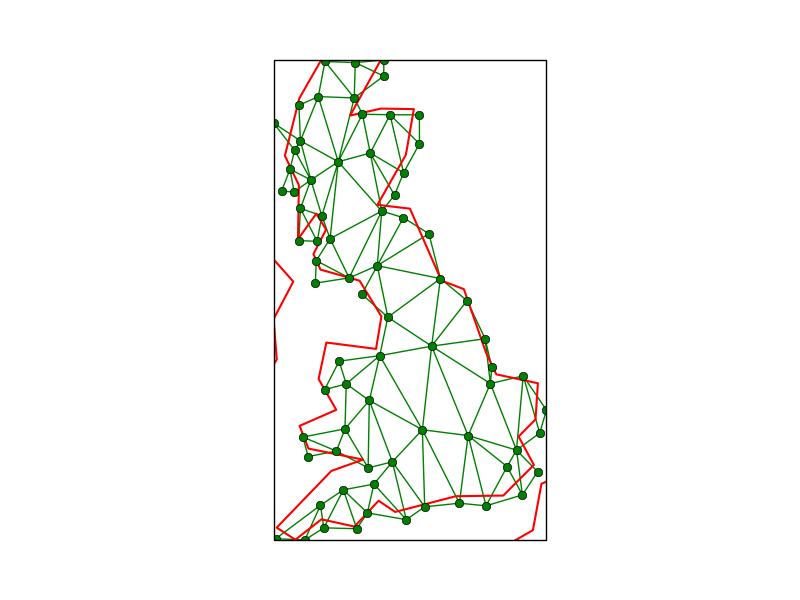
所以..。
我猜你的问题可能是,当点经过变换后,实际的三角剖分(即点以三角形连接)不再合适。
最明显的原因是三角形在投影中穿过一个“接缝”。例如,您可能有从-30到+30的经度,但希望在从0到360 map之间的地图上绘制。
这可能是原因吗?
https://stackoverflow.com/questions/32331775
复制相似问题
腾讯云开发者

Copyright © 2013 - 2026 Tencent Cloud. All Rights Reserved. 腾讯云 版权所有
深圳市腾讯计算机系统有限公司 ICP备案/许可证号:粤B2-20090059 ![]() 粤公网安备44030502008569号
粤公网安备44030502008569号
腾讯云计算(北京)有限责任公司 京ICP证150476号 | 京ICP备11018762号