
Python ( R)和Stata中线性回归的差异
我正在将Stata模型移植到Python,并使用相同的输入数据(可用@ https://drive.google.com/file/d/0B8PLy9yAUHvlcTI1SG5sdzdnaWc/view?usp=sharing)查看Python和Stata用于线性回归的不同结果。
Stata代码如下:
reg growth time*
predict ghat
predict resid, residuals
结果是(前5行):
. list growth ghat resid

     +----------------------------------+
     |    growth       ghat       resid |
     |----------------------------------|
  1. | 2.3527029   2.252279    .1004239 |
  2. |  2.377728   2.214551     .163177 |
  3. | 2.3547957   2.177441     .177355 |
  4. | 3.0027488   2.140942    .8618064 |
  5. | 3.0249328    2.10505    .9198825 |
在Python中,代码是:
import pandas as pd
from sklearn.linear_model import LinearRegression


def linear_regression(df, dep_col, indep_cols):
  lf = LinearRegression(normalize=True)
  lf.fit(df[indep_cols.split(' ')], df[dep_col])

  return lf

df = pd.read_stata('/tmp/python.dta')
lr = linear_regression(df, 'growth', 'time time2 time3 time4 time5')

df['ghat'] = lr.predict(df['time time2 time3 time4 time5'.split(' ')])
df['resid'] = df.growth - df.ghat

df.head(5)['growth ghat resid'.split(' ')]
结果是:
     growth      ghat     resid
0  2.352703  3.026936 -0.674233
1  2.377728  2.928860 -0.551132
2  2.354796  2.833610 -0.478815
3  3.002749  2.741135  0.261614
4  3.024933  2.651381  0.373551
我也尝试了R,得到了与Python相同的结果。我无法找出根本原因:是因为Stata中使用的算法有点不同吗?从源代码中我可以看出sklearn使用的是普通的最小二乘,但对Stata中的最小二乘却一无所知。
有人能给我建议吗?
我试图将Stata中的数据类型指定为double,但是Stata仍然产生与使用float相同的结果。用于生成的Stata代码如下:
gen double growth = .
foreach lag in `lags' {
    replace growth = ma_${metric}_per_`group' / l`lag'.ma_${metric}_per_`group' - 1 if nlag == `lag' & in_sample
}

gen double time = day - td(01jan2010) + 1
forvalues i = 2/5 {
    gen double time`i' = time^`i'
}结果表明,由于共线性关系,Stata确实降低了time变量。这条消息以前没有见过,因为我们的Stata代码使quiet模型能够抑制不想要的消息。根据我的调查,这在斯塔塔是不能被禁用的。因此,在Python中,我似乎也需要检测共线性并删除共线列。
. reg growth time*,
note: time omitted because of collinearity

      Source |       SS       df       MS              Number of obs =     381
-------------+------------------------------           F(  4,   376) =  126.10
       Model |  37.6005042     4  9.40012605           Prob > F      =  0.0000
    Residual |  28.0291465   376  .074545602           R-squared     =  0.5729
-------------+------------------------------           Adj R-squared =  0.5684
       Total |  65.6296507   380  .172709607           Root MSE      =  .27303

------------------------------------------------------------------------------
      growth |      Coef.   Std. Err.      t    P>|t|     [95% Conf. Interval]
-------------+----------------------------------------------------------------
        time |          0  (omitted)
       time2 |  -.0098885   .0009231   -10.71   0.000    -.0117037   -.0080734
       time3 |   .0000108   1.02e-06    10.59   0.000     8.77e-06    .0000128
       time4 |  -4.40e-09   4.20e-10   -10.47   0.000    -5.22e-09   -3.57e-09
       time5 |   6.37e-13   6.15e-14    10.35   0.000     5.16e-13    7.58e-13
       _cons |   3322.727   302.7027    10.98   0.000     2727.525     3917.93
------------------------------------------------------------------------------回答 2
Stack Overflow用户
发布于 2015-08-28 22:56:19
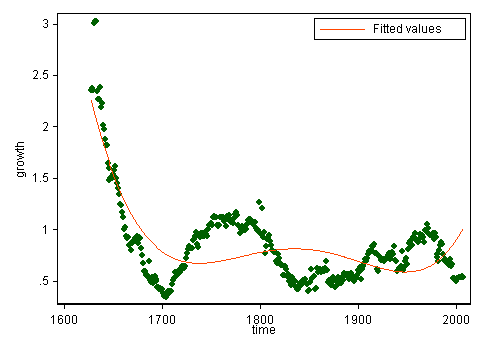
预测指标是time的第一.第五次权力,在1627年到2007年之间变化(想必是一个日历年,这并不重要)。即使有了现代软件,也要谨慎地改变时间的起源,以减少数值的压力,例如,使用(time - 1800)的能力。
无论如何,重做回归表明Stata将第一个预测值降为共线。Python和R会发生什么?这些都是对数字上棘手的挑战的不同反应。
(拟合五次多项式很少有科学价值,但这里可能并不关心这一点。基于幂2到5的拟合曲线对于这些数据并不是很好的工作,这些数据看起来很经济。更有道理的是,前5个残差都是正的,但并不是所有的都是正的!)
Stack Overflow用户
发布于 2015-08-28 22:44:20
这是一个不确定的问题。在您的Stata代码中,time*将匹配time2, time3...,而不匹配time。如果将Python代码更改为lr = linear_regression(df, 'growth', 'time2 time3 time4 time5'),它将产生完全相同的结果。
编辑
看来Stata掉了第一个自变量。它可以形象化如下:
lr1 = linear_regression(df, 'growth', 'time time2 time3 time4 time5')
lr2 = linear_regression(df, 'growth', 'time2 time3 time4 time5')
pred_x1 = ((np.linspace(1620, 2000)[..., np.newaxis]**np.array([1,2,3,4,5]))*lr1.coef_).sum(1)+lr1.intercept_
pred_x2 = ((np.linspace(1620, 2000)[..., np.newaxis]**np.array([2,3,4,5]))*lr2.coef_).sum(1)+lr2.intercept_
plt.plot(np.linspace(1620, 2000), pred_x1, label='Python/R fit')
plt.plot(np.linspace(1620, 2000), pred_x2, label='Stata fit')
plt.plot(df.time, df.growth, '+', label='Data')
plt.legend(loc=0)
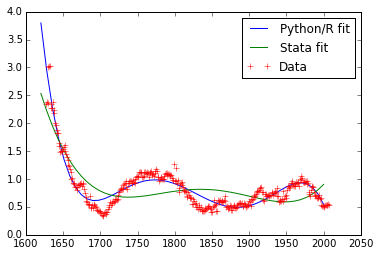
和残差平方和:
In [149]:

pred1 = (df.time.values[..., np.newaxis]**np.array([1,2,3,4,5])*lr1.coef_).sum(1)+lr1.intercept_
pred2 = (df.time.values[..., np.newaxis]**np.array([2,3,4,5])*lr2.coef_).sum(1)+lr2.intercept_
print 'Python fit RSS',((pred1 - df.growth.values)**2).sum()
print 'Stata fit RSS',((pred2 - df.growth.values)**2).sum()
Python fit RSS 7.2062436549
Stata fit RSS 28.0291464826https://stackoverflow.com/questions/32280444
复制相似问题
腾讯云开发者

Copyright © 2013 - 2026 Tencent Cloud. All Rights Reserved. 腾讯云 版权所有
深圳市腾讯计算机系统有限公司 ICP备案/许可证号:粤B2-20090059 ![]() 粤公网安备44030502008569号
粤公网安备44030502008569号
腾讯云计算(北京)有限责任公司 京ICP证150476号 | 京ICP备11018762号