
填充/预测python中矩阵的未知值
填充/预测python中矩阵的未知值
提问于 2015-08-26 13:43:44
我有一个过程,在矩阵的某些位置给出一些已知的值,例如,在一个1×1米的细胞上有多少人。所以,如果我们有一个5x6米的房间,也许我们只在一些细胞中检测到了一定数量的人。
现在我们想要创建一个热图或表面表示,因此有三个选项:
- 将未知单元设置为未知
- 将未知单元格设置为零。
- 尝试预测和填充未知的细胞。
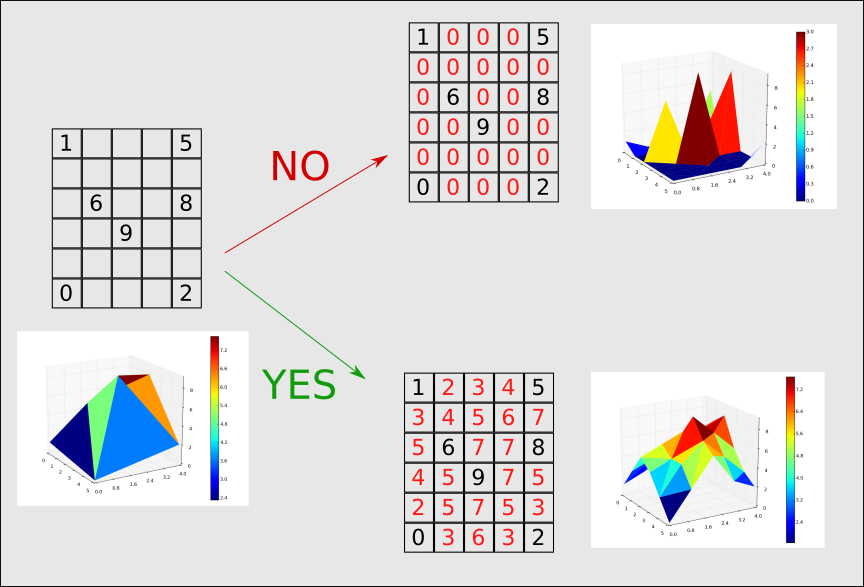
我想知道的是我如何在python中做第三个选项。我认为这种操作在图像处理中很常见(比如缩放)。这样做的目的是使热图与一组有限的数据平滑。
致以问候。
回答 1
Stack Overflow用户
回答已采纳
发布于 2015-08-26 16:54:51
假设您不需要在“是”矩阵中指定的确切边缘值(请参阅我的注释),下面是我要做的事情:
import numpy as np
from scipy.interpolate import griddata

nan = np.NaN
dat = np.array([[ 1,    nan,  nan,  nan,   5,],
                [ nan,  nan,  nan,  nan,  nan,],
                [ nan,  6,    nan,  nan,  8,  ],
                [ nan,  nan,  9,    nan,  nan,],
                [ nan,  nan,  nan,  nan,  nan,],
                [ 0,    nan,  nan,  nan,  2,  ]])

def fill_nans(indata, method='linear'):
    """
    Fill NaN values in the input array `indata`.
    """
    # Find the non-NaN indices
    inds = np.nonzero(~np.isnan(indata))
    # Create an `out_inds` array that contains all of the indices of indata.
    out_inds = np.mgrid[[slice(s) for s in indata.shape]].reshape(indata.ndim, -1).T
    # Perform the interpolation of the non-NaN values to all the indices in the array:
    return griddata(inds, indata[inds], out_inds, method=method).reshape(indata.shape)

out = fill_nans(dat)
print(out)
这给了,
[[ 1.          2.          3.          4.          5.        ]
 [ 0.8         4.          5.          5.83333333  6.5       ]
 [ 0.6         6.          6.66666667  7.33333333  8.        ]
 [ 0.4         5.25        9.          7.5         6.        ]
 [ 0.2         4.5         5.          5.5         4.        ]
 [ 0.          0.5         1.          1.5         2.        ]]
你也可以这么做
out2 = fill_nans(dat, method='cubic')
print(out2)
这给了,
[[ 1.          2.34765155  3.45834401  4.33986447  5.        ]
 [ 2.24368285  4.39570784  5.76911468  6.7162754   6.94217514]
 [ 2.88169911  6.          7.62769189  8.27187136  8.        ]
 [ 2.79787395  6.53998191  9.          8.99319441  7.42165234]
 [ 1.87603253  5.20787111  6.8176744   6.80953373  5.26441632]
[ 0. 1.73565977 2.59374609 2.65495937 2. ]]显然,如果您只需要整数值,可以将一个.round().astype(int)添加到fill_nans(...)调用的末尾,在这种情况下,out是:
[[1 2 3 4 5]
 [1 4 5 6 6]
 [1 6 7 7 8]
 [0 5 9 8 6]
 [0 4 5 6 4]
[0 0 1 2 2]]out2是:
[[1 2 3 4 5]
 [2 4 6 7 7]
 [3 6 8 8 8]
 [3 7 9 9 7]
 [2 5 7 7 5]
 [0 2 3 3 2]]
再一次,很明显,这些不是完全相同的‘是’矩阵,但希望这是有帮助的。祝你好运!
页面原文内容由Stack Overflow提供。腾讯云小微IT领域专用引擎提供翻译支持
原文链接:
https://stackoverflow.com/questions/32228374
复制相关文章
相似问题
腾讯云开发者

Copyright © 2013 - 2026 Tencent Cloud. All Rights Reserved. 腾讯云 版权所有
深圳市腾讯计算机系统有限公司 ICP备案/许可证号:粤B2-20090059 ![]() 粤公网安备44030502008569号
粤公网安备44030502008569号
腾讯云计算(北京)有限责任公司 京ICP证150476号 | 京ICP备11018762号