
如何根据高图表制作饼形图
我一直在努力,因为一些日子,做一个饼图,从高图表响应。我正在做一个中等规模的项目,有时很容易失去概述。
我已经检查过了:http://www.angulartutorial.net/2014/03/responsive-highchart.html,但没有成功。
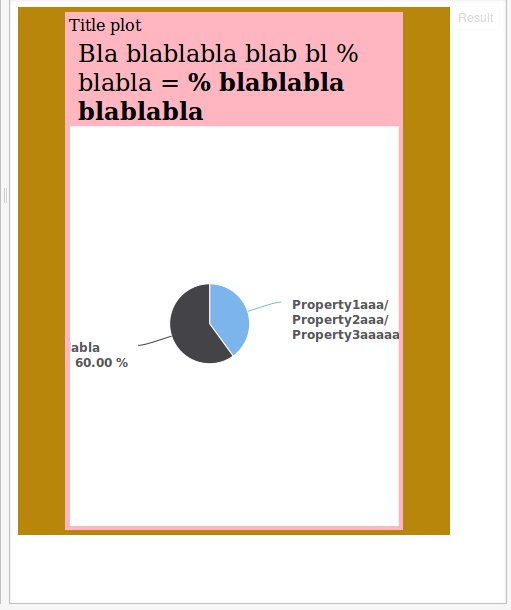
问题:当宽度为192 is时,高图看起来很好。当它是900 of时,饼(系列->数据)的描述就在浏览器之外,人们无法读取它,而且,这个饼对我来说太小了。
问题:如何避免这种行为?我想要一个更大的饼,并能够阅读(系列->数据)。
我提供以下代码:
我的HTML代码是:
<div id="container-independency" >
  <div id="independency" >
    <div>Title plot</div>
    <div style="margin-left: 2.8%; margin-top:1%; font-size: 24px;">Bla blablabla blab bl<span class="autarkie" > </span> % blabla = <strong> <span class="autarkie" >
    </span> % blablabla blablabla</strong></div>
     <div id="highcharts_container"></div>
  </div>
</div>
CSS代码:
#container-independency{
    width: 90%;
    max-width: 1620px;
    background-color: #b8860b;
    clear: both;
    padding: 1%;
    display: none;
    box-sizing: border-box;
}

#independency{
    width: 80%;
    margin-left: auto;
    margin-right: auto;
    padding: 1%;
    background-color: #ffb6c1;
    box-sizing: border-box;
}

#highcharts_container{
    width: 100%;
    margin-left: auto;
    margin-right: auto;
    box-sizing: border-box;

}
高图表:
('#highcharts_container').highcharts({
          chart: {
              plotBackgroundColor: null,
              plotBorderWidth: null,
              plotShadow: false,
              type: 'pie'
          },

          title:{
           text:''
          },

          credits: {
            enabled: false
           },

          navigation: {
            buttonOptions: {
                enabled: false
            }
          },

          tooltip: {
              pointFormat: '<b>{point.percentage:.1f}%</b>'
          },
          plotOptions: {
              pie: {
                  allowPointSelect: true,
                  cursor: 'pointer',
                  dataLabels: {
                      enabled: true,
                      format: '<b>{point.name}</b>: {point.percentage:.2f} %',
                      style: {
                          color: '#58585a',
                          fontFamily: 'klavika-web, sans-serif', fontSize: '12px'
                      }
                  }
              }
          },
          series: [{

              name: '',
              data: [
                 ['Property1aaa/Property2aaa/Property3aaaaaa', independency],
                 ['More blablabla blablabla', 100-independency],
              ]
          }]
        });//highcharts_container
更新:
回答 2
Stack Overflow用户
发布于 2015-08-24 15:35:11
每次图表更改时,都会触发图表的大小重绘事件。您可以在该事件中检查图表的宽度,并为系列调用额外的更新,因为如果您将标签的文本更改为带有<br>标记的文本,那么饼饼看起来很合适。如果您的问题更加复杂,解决方案仍将类似-检查大小和更新图表。
更改点名的示例:http://jsfiddle.net/j86jkfvj/114/
宽度<900 is:http://jsfiddle.net/dhwzw8qg/时的系列更新示例
Stack Overflow用户
发布于 2016-12-05 15:20:22
下面是一个基于页面大小调整事件重新绘制饼图的示例。我用过它,效果很好:
jsfiddle.net/4mo2qf79/12
HTML:
<div class="wrapper">
    <div id="container" style="width:100%;"></div>
</div>
联署材料:
$(function () {
    $('#container').highcharts({
        chart: {
            plotBackgroundColor: null,
            plotBorderWidth: null,
            plotShadow: false
       },
        title: {
            text: 'Responsive Resize'
        },
        tooltip: {
            pointFormat: '{series.name}: <b>{point.percentage:.1f}%</b>'
        },
        plotOptions: {
            pie: {
                allowPointSelect: true,
                cursor: 'pointer',
                dataLabels: {
                    enabled: true
                }
            }
        },
        series: [{
            type: 'pie',
            name: 'Browser share',
            data: [
                ['Firefox', 45.0],
                ['IE',      26.8],
                ['Safari',  8.5],
                ['Opera',   6.2],
                ['Others',  0.7]
            ]
        }]
    });

    function redrawchart(){
        var chart = $('#container').highcharts();

        console.log('redraw');
        var w = $('#container').closest(".wrapper").width()
        // setsize will trigger the graph redraw
        chart.setSize(
            w,w * (3/4),false
        );
     }

    $(window).resize(redrawchart);
    redrawchart();

});https://stackoverflow.com/questions/32118711
复制相似问题
腾讯云开发者

Copyright © 2013 - 2026 Tencent Cloud. All Rights Reserved. 腾讯云 版权所有
深圳市腾讯计算机系统有限公司 ICP备案/许可证号:粤B2-20090059 ![]() 粤公网安备44030502008569号
粤公网安备44030502008569号
腾讯云计算(北京)有限责任公司 京ICP证150476号 | 京ICP备11018762号