
基于多规格和R的批处理图像分析
是否可以使用R来使一批图像能够通过多个Spec (或任何其他程序-不包括ImageJ)来运行,而不是通过单个图像分析?
如果是的话,怎么做?
我用以下链接附上了我想要的图片:"http://figshare.com/s/f81b92ea474f11e5b78d06ec4bbcf141“"http://figshare.com/s/463ec4ce475011e5909106ec4b8d1f61”
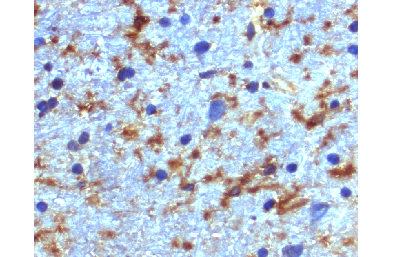
“编辑”图像是"ms485_a7c5,c3aR 40xgm1.tif“的副本,突出显示了我正在搜索的内容的方框。
围绕蓝色圆圈的黑匣子是我正在寻找的一组数据,特别是它们在图像中的数量以及它们所覆盖的图像的%区域。围绕着合并的蓝色和棕色区域的红色框也是我专门寻找的东西,与上面所需的值相同。最后,图像的棕色区域也是我所要寻找的,但只适用于图像中覆盖的%区域。
我能够执行分析1图像上的多规格,但我需要这是进行在1000+图像,并无法做到这一点,因为我不熟悉R或其他编码程序。
提前感谢
回答 1
Stack Overflow用户
发布于 2015-08-20 19:20:40
所以,我不知道这会让你走多远,但是每次处理每一幅图像都应该可以在你的记忆范围内完成。该方法概述是最基本的阈值应用于您的图像。可以采用更为复杂的方法:
library(raster)

i <- brick("./data/ms485_a7c5_c3aR_40x_gm_1.tif")
names(i) <- c("r", "g", "b")

##  Plot image:
plotRGB(i)
## Here you could use a more sophisticated classification method:
#k <- kmeans(i[], centers=4, iter.max = 100, nstart = 4)
#c <- raster(i)
#c[] <- c$cluster
## Instead we'll just set some simple thresholds:
c1 <- (i$r < 170 & i$g < 140 & i$b > 150)*1 ## Blues
c2 <- (i$r > 150 & i$g > 150 & i$b > 150)*2 ## Lights
c3 <- (i$r < 170 & i$g < 150 & i$b < 140)*3 ## Darks
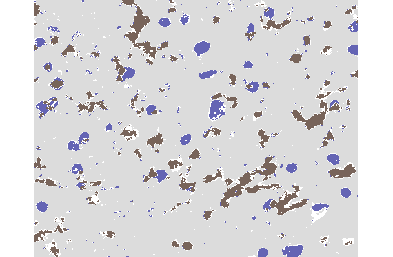
## Plot the classified data so you see what you're summarizing below:
plot(c, add=T, legend=F, col=c(
rgb(255, 255, 255, maxColorValue=255),
rgb(100, 100, 180, maxColorValue=255),
rgb(220, 220, 220, maxColorValue=255),
rgb(120, 100, 90, maxColorValue=255)
))
##  And calculate your summary stats by class:

t <- table(c[])
names(t) <- c("Unclassified", "Blues", "Lights", "Darks")
t

##  Unclassified        Blues       Lights        Darks
##        283887       220042      4475129       376942

##  Or we can calculate those cell counts as percentages of pixels:
t/ncell(c) * 100

##  Unclassified        Blues       Lights        Darks
## 5.300355 4.108327 83.553566 7.037752 现在,因为你还没有用一种能够准确识别你蓝色区域的技术分割或阈值你的图像,你就必须找出适合你的最佳方法。一旦您有了分类映像,您就可以使用SDMTools包来计算图像中出现的不同补丁等的数量。
##  To summarize distinct patches within your classified "Blues":
library(SDMTools)

##  Calculate stats, and count all patches for "Blues":
class_stats <- ClassStat(c1, cellsize=1, bkgd=0)
class_stats$n.patches

##  [1] 1858

##  Only count patches larger than 10 pixels:
image_clusters <- ConnCompLabel( c1 )
patch_stats <- PatchStat(image_clusters, cellsize=1)
sum(patch_stats[patch_stats$patchID>0,]$n.cell > 10)

## [1] 462https://stackoverflow.com/questions/32074992
复制相似问题
腾讯云开发者

Copyright © 2013 - 2026 Tencent Cloud. All Rights Reserved. 腾讯云 版权所有
深圳市腾讯计算机系统有限公司 ICP备案/许可证号:粤B2-20090059 ![]() 粤公网安备44030502008569号
粤公网安备44030502008569号
腾讯云计算(北京)有限责任公司 京ICP证150476号 | 京ICP备11018762号