
用z阶matlab绘制玫瑰图
用z阶matlab绘制玫瑰图
提问于 2015-08-15 17:22:08
我需要绘制图片的二维直方图。图片在HSL系统中。在HSl体系中,饱和度和亮度代替了红色、绿色、蓝色。
要素范围如下:
- 色调0360;
- 饱和度0100;
- 轻盈度0100;
我把图像从RGB转换为HSL。现在我想在HSL颜色系统中绘制图像的圆形直方图。
我想要这样的东西:
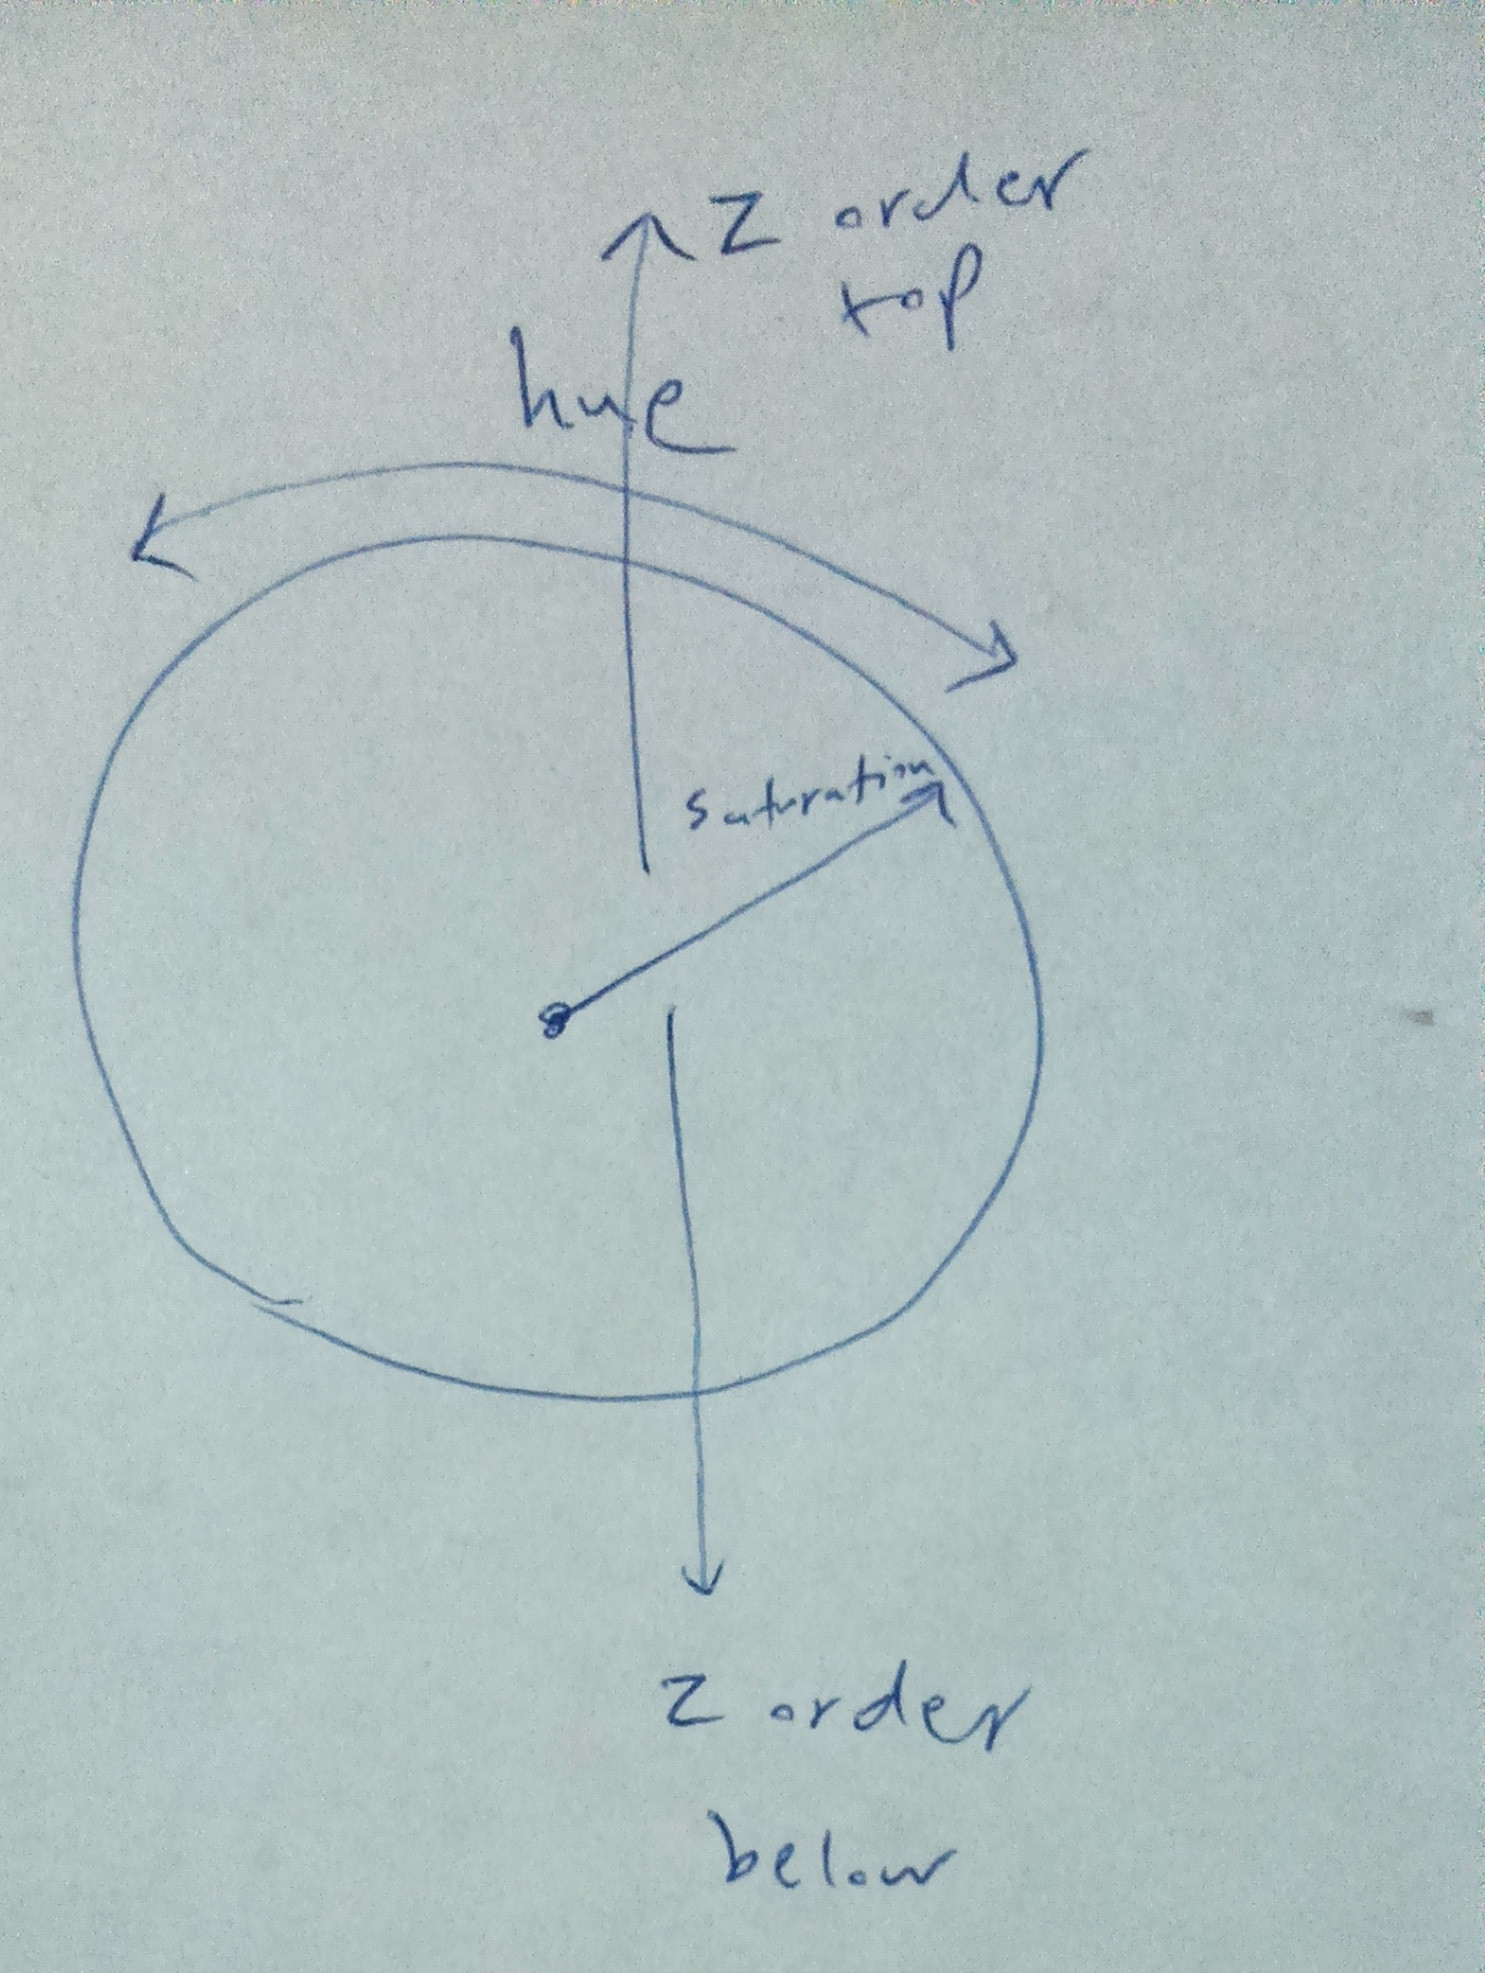
基于像素的色调数量,从中心到周长的饱和度,以及具有特定色调和饱和度的像素数,从0到360在圆周周围的色调。
例如,如果我们有250个像素,它们的hue=90和saturation=50,从原点90度到距圆心50度的z阶值。
回答 1
Stack Overflow用户
回答已采纳
发布于 2015-08-17 16:15:07
因为我不太喜欢Matlab的极坐标绘图仪,所以我通常把它们写成笛卡儿。因此,假设您将其中的每一个(计数、色调、饱和度)存储为列向量:
hue = 90;
saturation = 50;
count = 250;
x = saturation * cos(pi * hue / 180);
y = saturation * cos(pi * hue / 180);
plot3(x, y, count, '.')
一个更实际的例子是:
hue = floor(rand(1000,1) * 361);
saturation = floor(rand(1000,1) * 100);
vals = [hue, saturation];
sorted = sortrows(vals);
[C, ia, ic] = unique(sorted, 'rows');
counts = diff(ia);
counts(end + 1) = ia(end) - length(vals) + 1;
% Not a big fan of this method so changed to find counts
% by pre-sorting and then using the index
%[C, ia , ic] = unique(vals, 'rows');
%counts = zeros(length(C), 1);
%for x = 1:length(C)
%    counts(x) = numel(find(vals(:,1) == C(x,1) & vals(:,2) == C(x,2)));
%end
x = C(:,2) .* cos(pi*C(:,1)/180);
y = C(:,2) .* sin(pi * C(:,1)/180);
plot3(x, y, counts, '.')如果您想要的话,有一种方法可以根据z值改变颜色,但这会变得更加复杂。您既可以使用网格网格和等值线,也可以使用http://www.mathworks.com/matlabcentral/fileexchange/14677这个文件来绘制它。
页面原文内容由Stack Overflow提供。腾讯云小微IT领域专用引擎提供翻译支持
原文链接:
https://stackoverflow.com/questions/32027284
复制相关文章
相似问题
腾讯云开发者

Copyright © 2013 - 2026 Tencent Cloud. All Rights Reserved. 腾讯云 版权所有
深圳市腾讯计算机系统有限公司 ICP备案/许可证号:粤B2-20090059 ![]() 粤公网安备44030502008569号
粤公网安备44030502008569号
腾讯云计算(北京)有限责任公司 京ICP证150476号 | 京ICP备11018762号