
Python: Matplotlib: matplotlib中垂直对齐的绘图
Python: Matplotlib: matplotlib中垂直对齐的绘图
提问于 2015-08-04 13:19:14
我想从多个来源读取数据,并把它们画在另一个上面。我需要绘制它们的方式是在底部标记一个x-axis,而其他x-axis应该与相同的x-axis对齐,不管有什么点可用。
以下是这个问题的一个例子:
import matplotlib.pylab as plt
import random
import matplotlib.gridspec as gridspec

random.seed(20)

#create x-axis of my data
x1 = range(0,10) #different range than the next one
x2 = range(1,9)

#create data (just random data corresponding the x1,x2)
data1 = [random.random() for i in x1]
data2 = [random.random()*1000 for i in x2]

gs = gridspec.GridSpec(2,1)
fig = plt.figure()

#first plot
ax = fig.add_subplot(gs[0])
ax.plot(x1,data1)
ax.set_ylabel(r'Label One', size =16)
ax.get_yaxis().set_label_coords(-0.1,0.5)
plt.tick_params(
    axis='x',          # changes apply to the x-axis
    labelbottom='off') # labels along the bottom edge are off

#second plot
ax = fig.add_subplot(gs[1])
ax.plot(x2,data2)
ax.set_ylabel(r'Label Two', size =16)
ax.get_yaxis().set_label_coords(-0.1,0.5)

plt.show()
这就产生了情节:
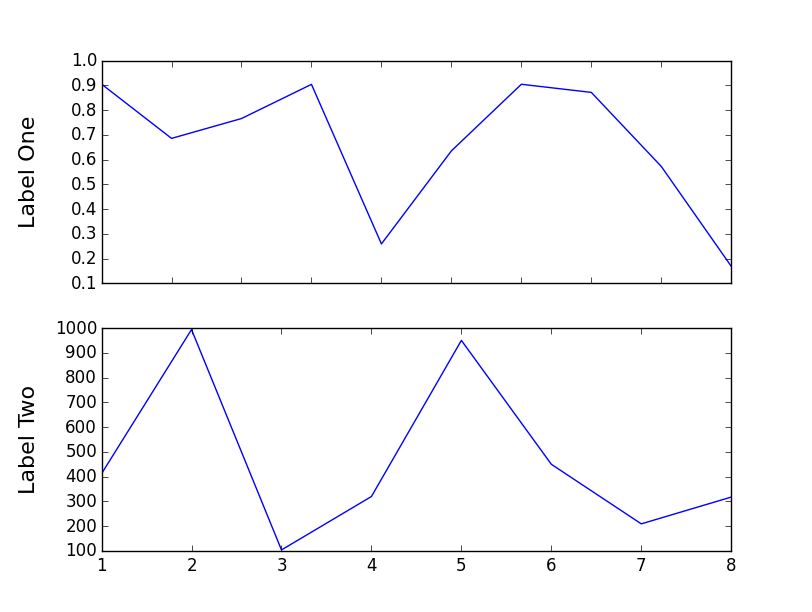
请注意,上面绘图的x-axis与下一个绘图的x-axis不匹配。
我需要所有的地块互相匹配,让小地块中没有数据的区域空置。能否做到这一点?
如果您需要更多的信息,请询问。
回答 1
Stack Overflow用户
回答已采纳
发布于 2015-08-04 13:33:20
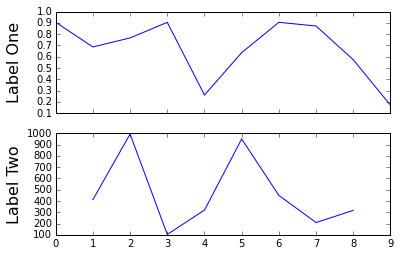
使用sharex参数对add_subplot()
import matplotlib.pylab as plt
import random
import matplotlib.gridspec as gridspec

random.seed(20)

#create x-axis of my data
x1 = range(0,10) #different range than the next one
x2 = range(1,9)

#create data (just random data corresponding the x1,x2)
data1 = [random.random() for i in x1]
data2 = [random.random()*1000 for i in x2]

gs = gridspec.GridSpec(2,1)
fig = plt.figure()

#first plot
ax = fig.add_subplot(gs[0])
ax.plot(x1,data1)
ax.set_ylabel(r'Label One', size =16)
ax.get_yaxis().set_label_coords(-0.1,0.5)
plt.tick_params(
    axis='x',          # changes apply to the x-axis
    labelbottom='off') # labels along the bottom edge are off

#second plot
ax = fig.add_subplot(gs[1], sharex=ax)
ax.plot(x2,data2)
ax.set_ylabel(r'Label Two', size =16)
ax.get_yaxis().set_label_coords(-0.1,0.5)

plt.show()
页面原文内容由Stack Overflow提供。腾讯云小微IT领域专用引擎提供翻译支持
原文链接:
https://stackoverflow.com/questions/31810461
复制相关文章
相似问题
腾讯云开发者

Copyright © 2013 - 2026 Tencent Cloud. All Rights Reserved. 腾讯云 版权所有
深圳市腾讯计算机系统有限公司 ICP备案/许可证号:粤B2-20090059 ![]() 粤公网安备44030502008569号
粤公网安备44030502008569号
腾讯云计算(北京)有限责任公司 京ICP证150476号 | 京ICP备11018762号