
X和Y标签太接近热图
X和Y标签太接近热图
提问于 2015-07-20 08:37:19
我怎么才能再往前挪一点呢?我在热图中使用了这样的代码:
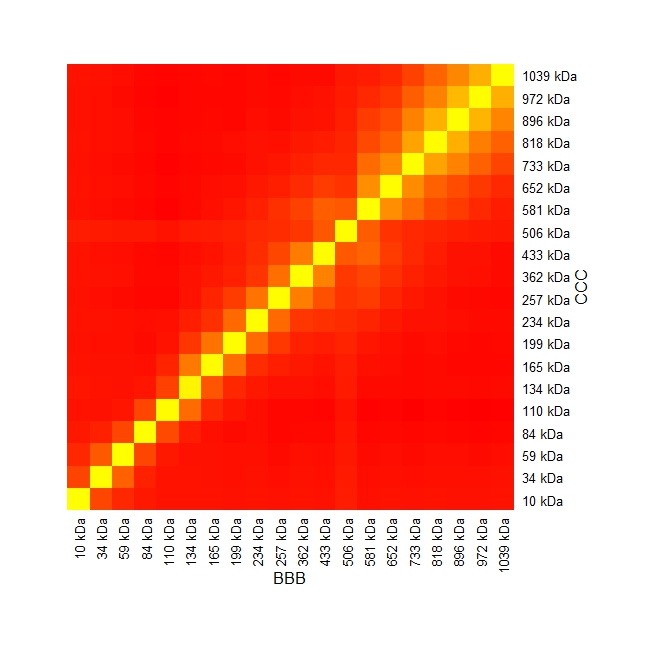
heatmap(mat_cor_results,Rowv=NA, Colv=NA,scale="none", col=hmcols, xlab= "BBB", ylab= "CCC") ##plot heatmap离热图太近了,看起来不太好.有什么办法改变吗?
回答 1
Stack Overflow用户
回答已采纳
发布于 2015-07-20 11:31:24
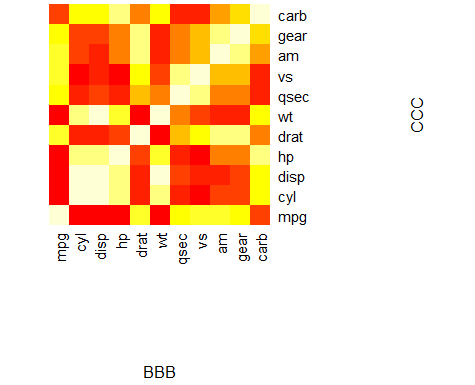
如果您打算在xlab和ylab中移动文本,只需使用margins = c(10,10),如下代码所示:
# Data cand chart
data(mtcars)
corr_cars <- cor(mtcars)
heatmap(corr_cars, Rowv=NA, Colv=NA, scale="none", xlab= "BBB", ylab= "CCC",
        margins = c(10,10))
会给你以下的热图:
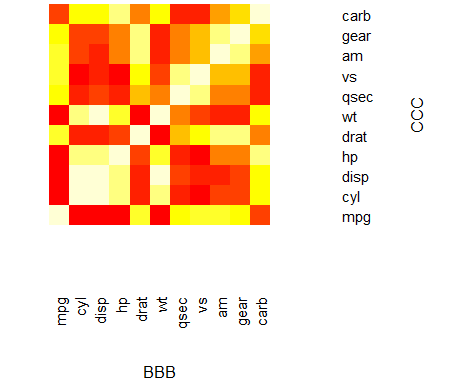
如果您的目的是移动值轴标签,则可以:
# Data cand chart with massive margins
data(mtcars)
corr_cars <- cor(mtcars)
# Insane space
par(mgp=c(5,5,5))
heatmap(corr_cars, Rowv=NA, Colv=NA, scale="none", xlab= "BBB", ylab= "CCC",
        margins = c(10,10))
这将产生:
页面原文内容由Stack Overflow提供。腾讯云小微IT领域专用引擎提供翻译支持
原文链接:
https://stackoverflow.com/questions/31512031
复制相关文章
相似问题
腾讯云开发者

Copyright © 2013 - 2026 Tencent Cloud. All Rights Reserved. 腾讯云 版权所有
深圳市腾讯计算机系统有限公司 ICP备案/许可证号:粤B2-20090059 ![]() 粤公网安备44030502008569号
粤公网安备44030502008569号
腾讯云计算(北京)有限责任公司 京ICP证150476号 | 京ICP备11018762号