
定制艺术家类的Matplotlib动画
目标
嗨,我正在尝试用几个子图动画一个复杂的图形,并且已经开始用艺术家动画和功能动画方法进行测试。
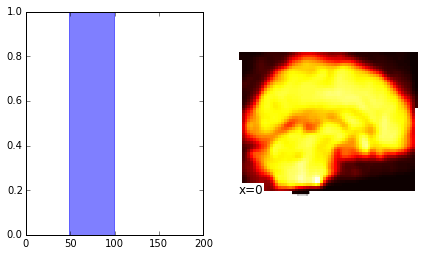
现在,我的目标是让左边的子图显示一条移动的彩色线(不是问题),右边的子图显示大脑扫描的更新表示(问题)。静态的,这个看起来像这样。
# Imports
import nilearn as nil
from nilearn import plotting as nlp
from matplotlib import pyplot as plt

window = np.arange(0,200-50)

fig = plt.figure(figsize=(7,4))
ax = fig.add_subplot(121)
ax.set_xlim([0, 200])
a = ax.axvspan(window[0], window[0]+50, color='blue', alpha=0.5)

ay = fig.add_subplot(122)
b = nlp.plot_stat_map(nil.image.index_img(s_img, 0), axes=ay, colorbar=False, display_mode='x', cut_coords=(0,))
问题
正如你所看到的,我正在使用尼尔温来绘制大脑图像。由于某些原因,来自plot_stat_map的nilearn对象不具有属性set_visible,而不像来自axvspan的matplotlib对象。
所以当我尝试这样一个简单的动画时:
fig = plt.figure(figsize=(7,4))
ax = fig.add_subplot(121)
ax.set_xlim([0, 200])
ay = fig.add_subplot(122)
iml = list()

for i in np.arange(50):
    a = ax.axvspan(window[i], window[i]+50, color='blue', alpha=0.5)
    b = nlp.plot_stat_map(nil.image.index_img(s_img, i), axes=ay)
    iml.append((a,b))

ani = animation.ArtistAniTruemation(fig, iml, interval=50, blit=False,
    repeat_delay=1000)
它崩溃时有以下错误:
/home/surchs/Enthought/Canopy_64bit/User/lib/python2.7/site-packages/matplotlib/animation.pyc in _init_draw(self)
    974         for f in self.new_frame_seq():
    975             for artist in f:
--> 976                 artist.set_visible(False)
    977                 # Assemble a list of unique axes that need flushing
    978                 if artist.axes not in axes:

AttributeError: 'OrthoSlicer' object has no attribute 'set_visible'
有道理,尼尔学可能不符合物质的期望。因此,我尝试了如下功能动画方法:
def show_things(i, window, ax, ay):
ax.axvspan(window[i], window[i]+50, color='blue', alpha=0.5)
nlp.plot_stat_map(nil.image.index_img(s_img, i), axes=ay, colorbar=False, display_mode='x', cut_coords=(0,))
fig = plt.figure(figsize=(7,4))
ax = fig.add_subplot(121)
ax.set_xlim([0, 200])
ay = fig.add_subplot(122)
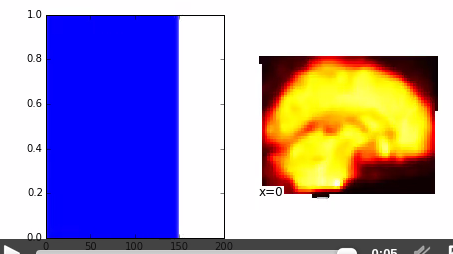
ani = animation.FuncAnimation(fig, show_things, interval=10, blit=False, fargs=(window, ax, ay))虽然我不确定我是否正确地使用东西,但这给了我一个动画大脑的右边。然而,左边的地块现在没有更新,而只是绘制出来。因此,我得到的不是滑动条,而是一个膨胀的颜色表面。就像这样:
问题
我该怎么做
- 使用函数动画方法?,我已经尝试了matplotlib中的ax.cla()函数,但是由于它也清除了所有的轴属性(比如xlim),这不是的解决方案。有离经叛道吗?
- 尽管定制的绘图类显然缺少了一个关键的属性,但仍然可以在右侧使用艺术家动画方法。
此外,我也不确定我是否正确地完成了整个实现部分,所以在这方面的任何建议也是非常感谢的。
回答 1
Stack Overflow用户
发布于 2015-07-20 10:20:19
我怀疑您可能需要清除axvspan轴与ax.cla()之间的绘图,以获得正确的左图(注:可能也应该清除右图)。为了解决缺少属性的问题,我建议从nlp.plot_stat_map返回的句柄中提取数据,并使用matplotlib pcolormesh (或imshow)绘图。另一种可能是创建子类并自己添加此方法。如果存在bug/特性请求,也可能值得提交给nilearn。
顺便说一句,如果你只想要一个快速而简单的情节,你可以用互动情节来制作穷人版的动画,作为一个最小的例子,
import matplotlib.pyplot as plt
import numpy as np
import time

#Interactive plot
plt.ion()

#Setup figures
fig = plt.figure(figsize=(7,4))
ax = fig.add_subplot(121)
ay = fig.add_subplot(122)
plt.show()


x = np.linspace(0,2*np.pi)
for i in range(10000):
    print(i)
    #Clear axes
    ax.cla(); ay.cla()

    #Update data
    yx = np.sin(x+i*0.1)
    yy = np.sin(2.*(x+i*0.1))

    #Replot
    ax.plot(x,yx)
    ay.plot(x,yy)

    #Pause to allow redraw
    plt.draw()
plt.pause(0.01)https://stackoverflow.com/questions/31509932
复制相似问题
腾讯云开发者

Copyright © 2013 - 2026 Tencent Cloud. All Rights Reserved. 腾讯云 版权所有
深圳市腾讯计算机系统有限公司 ICP备案/许可证号:粤B2-20090059 ![]() 粤公网安备44030502008569号
粤公网安备44030502008569号
腾讯云计算(北京)有限责任公司 京ICP证150476号 | 京ICP备11018762号