
如何在matlab中设计1~ 20 Hz的零相位带通滤波器?
如何在matlab中设计1~ 20 Hz的零相位带通滤波器?
提问于 2015-07-09 18:31:17
我使用Matlab对心电数据进行滤波。数据中有噪音,我试过使用Butterfilter。问题是那里有一个更高的功率黄油过滤器,任何高于3的东西都会使数据消失。
我已经看过Matlab的过滤器设计帮助指南,但我不清楚和仍然困惑如何实际使用它和实现它。
目的:对心电数据进行零相位失真滤波,滤波范围为1~ 20 Hz。
我现在的代码:
%takes in one channel of data from the dataMatrix, plots it, filters, and plots again in a new figure

channel = 150;
x = dataMatrix(:,channel);

plot(x)
rawTitle = sprintf('Raw Channel %d ', channel);
title(rawTitle)

figure
[b_pass a_pass] = butter(3, [1/1000 20/1000], 'bandpass');
plot(filtfilt(b_pass, a_pass, x))
channelTitle=sprintf('Filtered Channel %d ', channel);
title(channelTitle)回答 1
Stack Overflow用户
回答已采纳
发布于 2015-07-09 19:57:47
滤波器设计
让我们从在Matlab中设计巴特沃斯滤波器的基础开始。这里,我们只能定义一个使用归一化频率的滤波器。因此,我们需要知道采样频率fs来确定像这样的归一化频率fn:fn = f/fs。然后我们需要命令order和两个截止频率fc1和fc2。butter的第二个参数的“频率”从0到1,其中1对应于奈奎斯特速率,即采样频率fs的一半。因此,在第二个论点中,我们必须将fs除以2。
[b,a] = butter(order, [fc1,fc2]/(fs/2), 'bandpass');应用程序
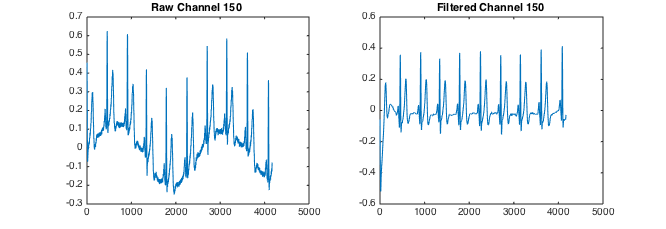
现在我们可以进入您的代码并应用过滤器。请注意,filtfilt为零相位,使原始滤波器的阶数加倍.我们可以从这里 (fs假设为500 if )中获取一些样本数据,看看它是否能像预期的那样工作。
% load sample data and assign it to x
load('ecg.mat');
fs = 500;
x = ecg;

% define to use OP's code
channel = 150;

% plot the raw data
figure
plot(x)
rawTitle = sprintf('Raw Channel %d ', channel);
title(rawTitle)

% design filter
[b_pass,a_pass] = butter(3,[1,20]/(fs/2), 'bandpass');

% filter data and plot it
figure
plot(filtfilt(b_pass, a_pass, x))
channelTitle=sprintf('Filtered Channel %d ', channel);
title(channelTitle)
其结果是:
页面原文内容由Stack Overflow提供。腾讯云小微IT领域专用引擎提供翻译支持
原文链接:
https://stackoverflow.com/questions/31325491
复制相关文章
相似问题
腾讯云开发者

Copyright © 2013 - 2026 Tencent Cloud. All Rights Reserved. 腾讯云 版权所有
深圳市腾讯计算机系统有限公司 ICP备案/许可证号:粤B2-20090059 ![]() 粤公网安备44030502008569号
粤公网安备44030502008569号
腾讯云计算(北京)有限责任公司 京ICP证150476号 | 京ICP备11018762号