
用datatip显示Matlab图例文本
用datatip显示Matlab图例文本
提问于 2015-07-06 11:43:13
在某些情况下,除了x-和y-值之外,还可以方便地让数据池显示相应的图例条目。
如何使Matlab在绘制的数据点的数据中显示相应的图例文本?
回答 2
Stack Overflow用户
回答已采纳
发布于 2015-07-06 12:13:24
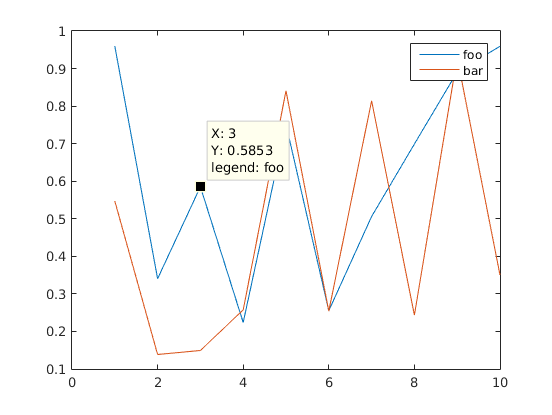
您可以通过编程提供自定义UpdateFcn来自定义数据中显示的数据。
示例:
fh = figure;
plot(rand(10,2));
legend('foo', 'bar');

datacursormode on;
dcm = datacursormode(fh);
set(dcm,'UpdateFcn',@customdatatip)
customdatatip.m
function output_txt = customdatatip(obj,event_obj,str)
pos = get(event_obj, 'Position');
output_txt = {...
    ['X: ', num2str(pos(1),4)]...
    ['Y: ', num2str(pos(2),4)] ...
    ['legend: ', event_obj.Target.DisplayName]...
};
输出
Stack Overflow用户
发布于 2015-07-06 11:50:24
可以设置一个自定义函数来创建datatip文本。简单的方法是右击情节,选择“选择-”或“编辑文本更新功能”。
该函数接收一个事件对象,其“Target”属性是单击数据的句柄。当使用图例时,文本存储在该数据的“DisplayName”属性中。
以下是一个实现:
function output_txt = legendtip( obj,event_obj)
% Display the position of the data cursor
% obj          Currently not used (empty)
% event_obj    Handle to event object
% output_txt   Data cursor text string (string or cell array of strings).


try
    p = get(event_obj,'Target');
    legendtext = get((get(event_obj,'Target')),'DisplayName');
catch err
    disp(err.message)
end

pos = get(event_obj,'Position');

if ~isempty(title)
    output_txt = {legendtext ,...
        ['X: ' num2str(pos(1),4)],...
        ['Y: ' num2str(pos(2),4)]};
else
    output_txt = {['X: ' num2str(pos(1),4)],...
        ['Y: ' num2str(pos(2),4)]};
end
在2014年b测试。
页面原文内容由Stack Overflow提供。腾讯云小微IT领域专用引擎提供翻译支持
原文链接:
https://stackoverflow.com/questions/31244981
复制相关文章
相似问题
腾讯云开发者

Copyright © 2013 - 2026 Tencent Cloud. All Rights Reserved. 腾讯云 版权所有
深圳市腾讯计算机系统有限公司 ICP备案/许可证号:粤B2-20090059 ![]() 粤公网安备44030502008569号
粤公网安备44030502008569号
腾讯云计算(北京)有限责任公司 京ICP证150476号 | 京ICP备11018762号