
用matplotlib求角
用matplotlib求角
提问于 2015-06-30 16:43:02
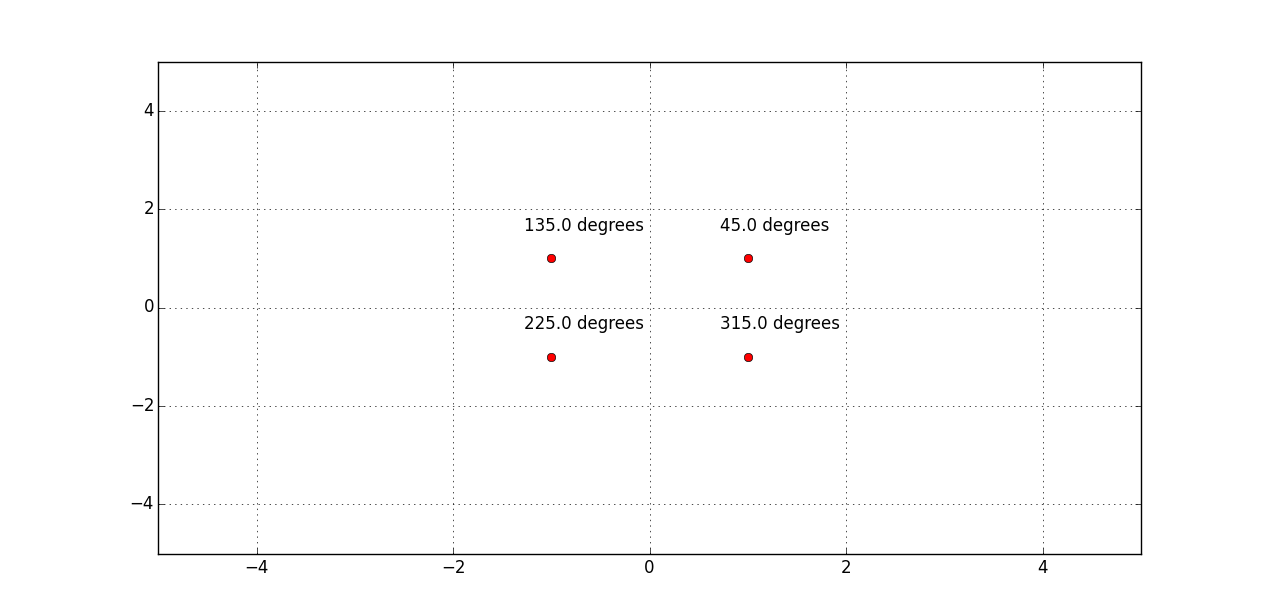
我对使用matplotlib相当陌生,也找不到任何例子来说明如何标记点的角度。我需要找到所有四个象限的角度,如果点是(1,1) angle=45度,(-1,1) angle= 135度,(-1,-1) angle=225度,对于(1,-1)应该是315度。
下面是我需要添加到其中的函数:
def visualize(val,ar):
   plt.figure()
   ax = plt.gca()
   ax.plot([val-5],[ar-5], marker='o', color='r')
   ax.set_xlim([-5,5])
   ax.set_ylim([-5,5])
   plt.draw()
   plt.grid()
plt.show() 回答 1
Stack Overflow用户
回答已采纳
发布于 2015-06-30 23:53:10
我认为你需要自己对你的分数做数学,然后用annotate()注释绘图上的分数。从您的示例中很难看出val和ar是单个值还是向量--考虑到您使用的语法,我认为是单个值。下面是一个函数来做数学的例子和一个使用annotate的例子--我尝试保持绘图位与您的代码相同,只需要添加位来计算度,然后将它们放在轴上
import math
import matplotlib.pyplot as plt

#This function does the maths - turns co-ordinates into angles
#with 0 on +ve x axis, increasing anti-clockwise
def get_theta(x,y):
    theta = math.atan(y*1.0/x) / (2*math.pi) * 360
    if x < 0:
        theta += 180
    if theta < 0:
        theta += 360
    return theta

def visualize(val,ar):
    ax = plt.gca()
    ax.plot([val-5],[ar-5], marker='o', color='r')
    ax.set_xlim([-5,5])
    ax.set_ylim([-5,5])
   #insert the following to calculate the angles and
   #then annotate them on the plot
    x,y = val-5,ar-5
    label = get_theta(x, y)
    ax.annotate(str(label)+' degrees', xy = (x, y), xytext = (-20, 20),textcoords = 'offset points')

if __name__ == '__main__':
    plt.figure()
    x = [6,4,4,6]
    y = [6,6,4,4]
    for (val, ar) in zip(x,y):
        visualize(val,ar)

    plt.draw()
    plt.grid()
plt.show() 关于您可以使用注释所做的更多的变化是在医生里。
输出
页面原文内容由Stack Overflow提供。腾讯云小微IT领域专用引擎提供翻译支持
原文链接:
https://stackoverflow.com/questions/31143854
复制相关文章
相似问题
腾讯云开发者

Copyright © 2013 - 2026 Tencent Cloud. All Rights Reserved. 腾讯云 版权所有
深圳市腾讯计算机系统有限公司 ICP备案/许可证号:粤B2-20090059 ![]() 粤公网安备44030502008569号
粤公网安备44030502008569号
腾讯云计算(北京)有限责任公司 京ICP证150476号 | 京ICP备11018762号