
如何分析Django的扩展瓶颈?
如何分析Django的扩展瓶颈?
提问于 2015-06-25 13:26:02
我使用django和tastypie作为REST。
对于分析,我使用的是django-silk和下面的请求摘要:
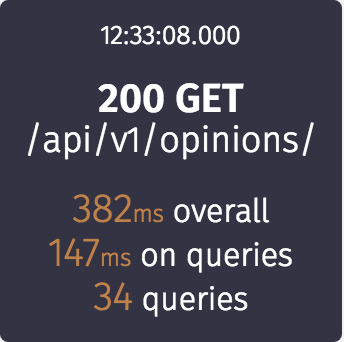
如何分析整个流程?除数据库查询外,所需时间平均为(382至147) ms。我如何找出瓶颈和优化/规模?对于这个资源,我确实使用了@silk_profile()作为get_object_list方法,但是即使这个方法似乎也不是瓶颈。
我使用缓存来减少响应时间,但这并没有多大帮助,还有其他选择吗?
当使用loader.io进行测试时,服务器可以处理的峰值是每30秒1000个请求(这似乎非常低)。除了缓存(我已经尝试过)之外,还有什么可以帮助的呢?
回答 2
Stack Overflow用户
发布于 2015-06-25 19:46:27
以下是一系列建议:
- 将每个请求的查询至少降低到每个请求5个以下(每个请求有34个非常糟糕)
- 安装django工具栏,查看花在哪里的时间
- 在反向代理(NGINX)后面使用gunicorn或uwsgi (NGINX)
Stack Overflow用户
发布于 2015-06-29 12:48:28
- 您有太多的查询,即使查询速度相对较快,您也会花费一些时间访问数据库等。此外,如果您有外部缓存存储(例如,redis),可能需要一段时间才能连接到那里。
- 要研究代码的慢部分,您有两个选项:
- Use a profiler - profiling at local PC could make no sense if you have distributed system deployed to several machines
- Add tracing points to your code that will record some message and current time (something like [https://gist.github.com/dbf256/0f1d5d7d2c9aa70bce89](https://gist.github.com/dbf256/0f1d5d7d2c9aa70bce89)). Deploy this patched code and test it with your load-testing tool and check logs.
页面原文内容由Stack Overflow提供。腾讯云小微IT领域专用引擎提供翻译支持
原文链接:
https://stackoverflow.com/questions/31051693
复制相关文章
相似问题
腾讯云开发者

Copyright © 2013 - 2026 Tencent Cloud. All Rights Reserved. 腾讯云 版权所有
深圳市腾讯计算机系统有限公司 ICP备案/许可证号:粤B2-20090059 ![]() 粤公网安备44030502008569号
粤公网安备44030502008569号
腾讯云计算(北京)有限责任公司 京ICP证150476号 | 京ICP备11018762号