
如何使用rmarkdown和pandoc在表中编写多层次(项目)列表
我希望使用rmarkdown、knitr和pander在PDF文档中创建一个表。我可以创建一个简单子弹列表,但现在需要该列表中的另一个级别。在下表中,我要求"Rave reviews“项目成为”提供研讨会.“的子项目。子弹。
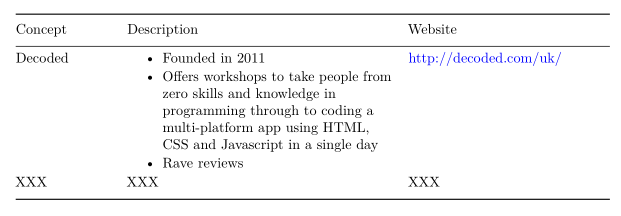
我遇到的问题与Description列中的Description数据line中下面的代码行有关。尽管我试图使用\x201创建子项目所需的4个空格,但这些空格不会出现,因此也不会出现子符号(尽管没有显示错误)。我还尝试了一种最明显的方法,即在代码中添加4个空格,但没有效果。还尝试将我的R选项设置为包含strip.white = FALSE,但这也没有什么帮助(参见下面)。
---
title: "xxx"
author: "xxx"
output:
  pdf_document:
    fig_height: 4
    fig_width: 10
    highlight: tango
  word_document: default
geometry: margin=3cm
---

```{r global_options, include=FALSE, echo=FALSE}
需要(针织品)
opts_chunk$set(fig.width=8,fig.height=4,fig.path='figs/',dpi=500,
echo=FALSE, warning=FALSE, message=FALSE, results='hide', strip.white = FALSE)```{r pandoc_options, include=FALSE, echo=FALSE}要求(拉皮条)
panderOptions(“数字”,3)
panderOptions(“圆形”,3)
panderOptions(‘mem.trailing.zeros’,真)
panderOptions(‘main.line.disks’,TRUE)
```{r concepts, echo=FALSE}mytable = data.frame(
Concept = c("Decoded", "XXX"),Description = c("* Founded in 2011\ \n* Offers workshops to take people from zero skills and knowledge in programming through to coding a multi-platform app using HTML, CSS and Javascript in a single day\ \n\x20\x20\x20\x20+ Rave reviews", "XXX"),Website = c("http://decoded.com/uk/","XXX"))``` {r concepts_descriptions, results = 'asis'}pander:pander(mytable,keep.line.breaks = TRUE,style = 'grid',left= 'left')
参考文献
回答 2
Stack Overflow用户
发布于 2015-06-25 12:31:25
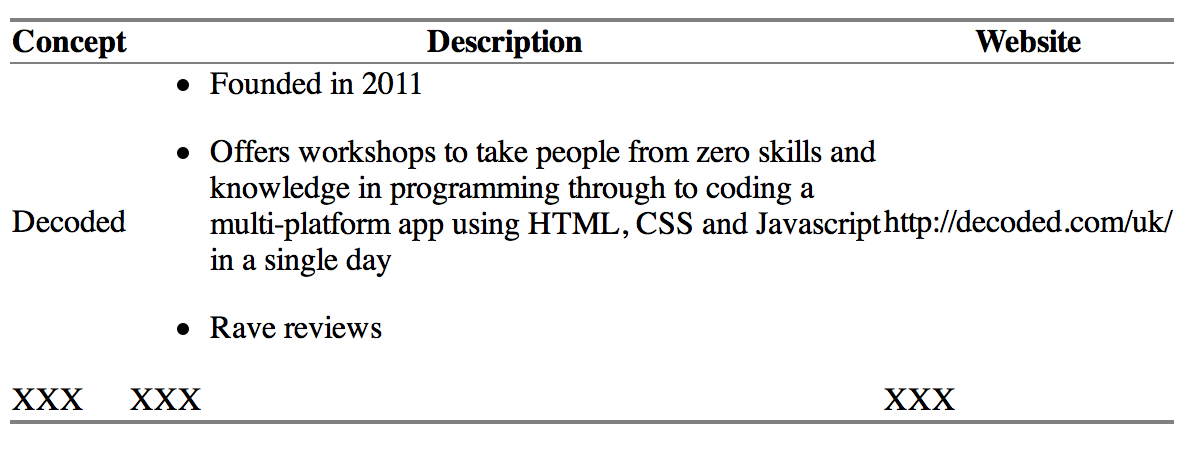
您可以在项目内嵌套项目:
```{r concepts, echo=FALSE}mytable = data.frame(
Concept = c("Decoded", "XXX"),Description = c("* Founded in 2011\ \n* Offers workshops to take people from zero skills and knowledge in programming through to coding a multi-platform app using HTML, CSS and Javascript in a single day\ \n\\begin{itemize} \\item Rave reviews \n \\item e.t.c\\end{itemize}", "XXX"),Website = c("http://decoded.com/uk/","XXX"))Stack Overflow用户
发布于 2015-06-25 12:31:50
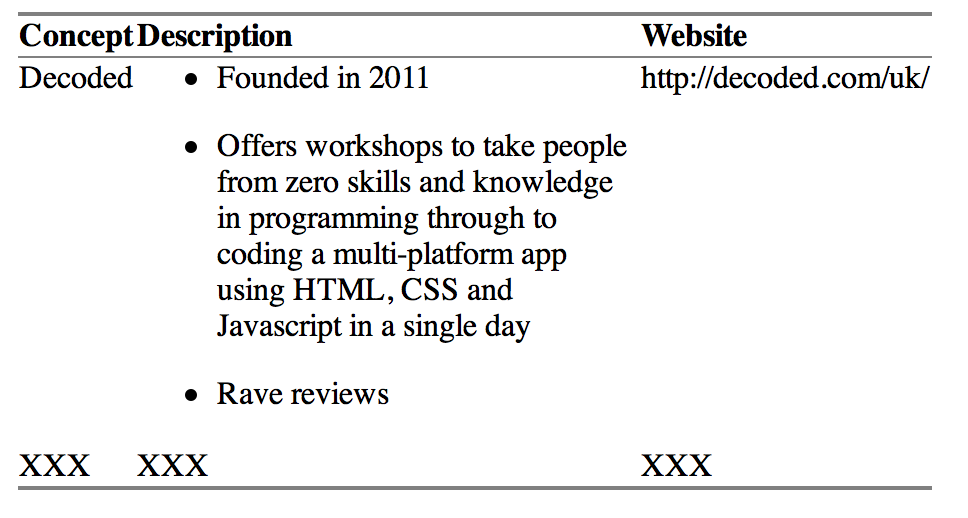
编辑:我不知道你在使用pdf,但这里有一个html解决方案
- 我会用矩阵
- 我将使用htmlTable包,它允许的表要比可访问表或pander高级得多。
首先为您的列表做一个包装器。
make_list <- function(...) {
  paste0("<ul>", sprintf('<li>%s</li>', substitute(...())), '</ul>', collapse = '')
}

make_list(one, two, three)

# [1] "<ul><li>one</li></ul><ul><li>two</li></ul><ul><li>three</li></ul>"


library('htmlTable')
mytable <- matrix(c("Decoded", "XXX",
                    make_list('Founded in 2011', 'Offers workshops to take people from zero skills and knowledge in programming through to coding a multi-platform app using HTML, CSS and Javascript in a single day','Rave reviews'),
                    "XXX",
                    "http://decoded.com/uk/","XXX"), 2,
                  dimnames = list(NULL, c('Concept','Description','Website')))

htmlTable(mytable, align = 'lll')
这是好的,但垂直对齐是不好的,盒子太宽。但是我们可以用htmlTable的一个css参数进行修正。垂直对齐将文本推送到顶部而不是中间,最大宽度设置文本包装,自动宽度允许每个文本都有自己的宽度。
htmlTable(mytable, align = 'lll', align.header = 'lll',
          css.cell = "width: auto; max-width: 250px; vertical-align: top;")
https://stackoverflow.com/questions/31049691
复制相似问题
腾讯云开发者

Copyright © 2013 - 2026 Tencent Cloud. All Rights Reserved. 腾讯云 版权所有
深圳市腾讯计算机系统有限公司 ICP备案/许可证号:粤B2-20090059 ![]() 粤公网安备44030502008569号
粤公网安备44030502008569号
腾讯云计算(北京)有限责任公司 京ICP证150476号 | 京ICP备11018762号