
Matlab谱图、黄油和滤波函数问题
Matlab谱图、黄油和滤波函数问题
提问于 2015-06-23 17:00:21
- 我如何改变光谱图的颜色,以显示更强烈的接近紫色,而不那么强烈接近红色?
- 如何将黄油和过滤器功能应用于wav文件以显示:
- a lowpass cutting frecuency of 4500hz
- a bandstop with central fecruency of 3000 hz and bandwith of 1000 hz
然后在光谱中显示这些过滤过的信号?
回答 2
Stack Overflow用户
发布于 2015-06-23 21:51:36
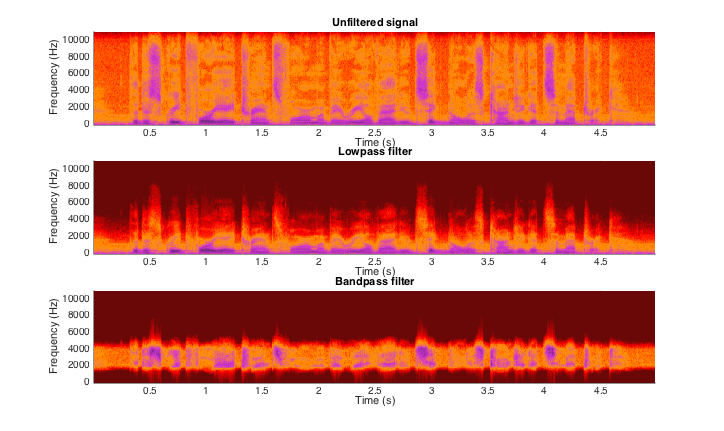
下面的Matlab代码应该能做你想做的事情。过滤器设计的参数被定义为变量,可以更改以调整过滤器。如果你想把情节分开,只需删除subplot(3,1,x),把figure放在spectrogram之前。那你就有三个单独的地块了。
若要使用.wav-file,请删除加载示例数据的行,并使用audioread-command取消对该行的注释。
load('speech_dft.mat');         % sample Matlab data
%[y,fs] = audioread(hfile);      % read wav-file

% Define a custom colormap
cmap = [0.4160    0.0350    0.0350;
        0.5620    0.0260    0.0260;
        0.7080    0.0180    0.0180;
        0.7810    0.0130    0.0130;
        0.9270    0.0040    0.0040;
        1.0000         0         0;
        1.0000    0.1410         0;
        1.0000    0.2120         0;
        1.0000    0.3530         0;
        1.0000    0.3880         0;
        1.0000    0.5290         0;
        1.0000    0.5650         0;
        0.9790    0.5480    0.1120;
        0.9570    0.4950    0.2240;
        0.9250    0.4170    0.3920;
        0.9040    0.3650    0.5040;
        0.8710    0.2860    0.6710;
        0.8130    0.2040    0.8160;
        0.7860    0.2010    0.7930;
        0.7060    0.1910    0.7240;
        0.5990    0.1770    0.6320;
        0.4390    0.1570    0.4940];

% Define nfft, window and noverlap
nfft     = 256;
window   = hanning(nfft);
noverlap = round(nfft/2);

% Display the spectrogram of the unfiltered signal
figure;
subplot(3,1,1);
spectrogram(y,window,noverlap,nfft,fs,'yaxis');
colormap(cmap);
title('Unfiltered signal');

% Design and apply the lowpass filter
order = 4;
fg    = 4500;
[b,a] = butter(order,fg/fs/2,'low');             % design filter
x1    = filter(b,a,y);                           % apply filter

% Display the spectrogram of the lowpass filtered signal
subplot(3,1,2);
spectrogram(x1,window,noverlap,nfft,fs,'yaxis');
colormap(cmap);
title('Lowpass filter');

% Design and apply the bandpass filter
order   = 10;
lowfreq = 2000;
hifreq  = 4000;
[b,a]   = butter(order,[lowfreq,hifreq]/(fs/2), 'bandpass'); % design filter
x2      = filter(b,a,y);                                     % apply filter

% Display the spectrogram of the bandpass filtered signal
subplot(3,1,3);
spectrogram(x2,window,noverlap,nfft,fs,'yaxis');
colormap(cmap);
title('Bandpass filter');
它产生以下结果:
Stack Overflow用户
发布于 2015-06-23 21:53:34
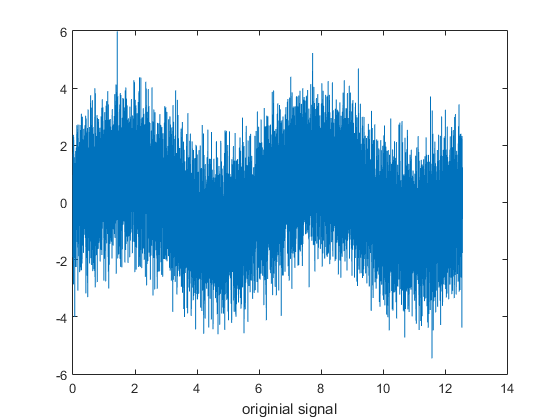
好的,我将给出一个更好的例子,说明注释部分中讨论的内容。我希望你觉得这很有用。基本上有一个噪声的正弦波信号。我做了一个谱图,然后过滤掉一些噪声,再做另一个谱图来显示滤波的结果。
x = 0:0.001:4*pi;
y = sin(x);
y2 = wgn(1,length(x),0.5);
y3 = sin(314*x);
y4 = y+y3+y2;
figure(1)
plot(x,y4);
nfft = 2^nextpow2(length(y4));
[S,F,T,P] = spectrogram(y4,250,50,nfft,1000);
figure(2)
spectrogram(y4,250,50,nfft,1000);
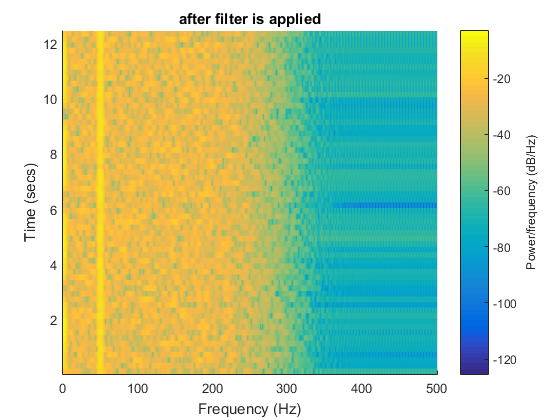
%create filter and use it on the noisy signal
[b,a] = butter(4,0.5,'low');
y5 = filtfilt(b,a,y4);
figure(3)
spectrogram(y5,250,50,nfft,1000);以下是所生成的地块:
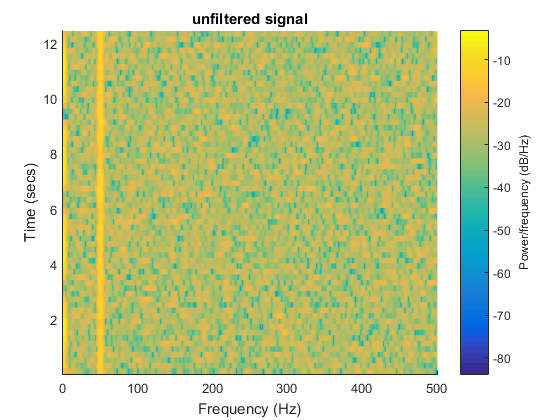
正如你所看到的,谱图调用有默认的颜色缩放,你可以通过图形句柄改变颜色,如果你想知道怎么做的话,我会问另一个问题,或者谷歌它。
请听取马特在评论部分的建议,他警告说,您需要确定如何过滤wav文件。
页面原文内容由Stack Overflow提供。腾讯云小微IT领域专用引擎提供翻译支持
原文链接:
https://stackoverflow.com/questions/31008997
复制相关文章
相似问题
腾讯云开发者

Copyright © 2013 - 2026 Tencent Cloud. All Rights Reserved. 腾讯云 版权所有
深圳市腾讯计算机系统有限公司 ICP备案/许可证号:粤B2-20090059 ![]() 粤公网安备44030502008569号
粤公网安备44030502008569号
腾讯云计算(北京)有限责任公司 京ICP证150476号 | 京ICP备11018762号