
在R降水数据中创建循环定义区间开始和结束
我想分析南美的降水数据。我的目标是利用每年累积降雨量的百分比来确定雨季的开始和抵消。
我的数据有格式
Date        Precip
1939-11-01  0
1939-11-02  0
1939-11-03  0
1939-11-04  4.9
1939-11-05  0
1939-11-06  0.7
1939-11-07  3.5
lapply1<-read.table("lapply.txt",header=T)
lapply1$Date<-as.Date(lapply1$Date)
一年来,我这样做的方法是:
cumsum(Precip/(sum(Precip)/100)
我想写一个从每年y-07-01开始,到(y+1)-06-30结束的lopp
我试过这个:
lapply(lapply, function(cumsum(lapply1$Precip/(sum(lapply1$Precip)/100)),
    ts(lapply1, freq=4, start=c(y-01-01), end=c(y+1-06-30), names(lapply1)))
我不知道如何设置开始和结束的间隔和定义。另外,我还有很多NAs。这会不会是个问题?
回答 1
Stack Overflow用户
发布于 2015-06-23 17:44:11
您尝试使用的R时间序列方法ts,在每个时间单位有相同数量的值时,可能是适当的,就像每年有12个月的月份和年份一样。但是,由于一年中的天数因闰年而发生变化,对于您的每日数据,您可以使用zoo包,它可以表示不规则的时间序列。使用zoo,唯一的问题是你在中间而不是在年底开始你的一年。下面是处理这个问题的方法之一。这段代码还通过删除数据来处理数据中的NA。
library(zoo)
df <- read.table(header=TRUE,
text="Date        Precip
1939-11-01  0
1939-11-02  0
1939-11-03  0
1939-11-04  4.9
1939-11-05  0
1939-11-06  0.7
1939-11-07  3.5")
precip_data <- zoo(df[,-1, drop=FALSE], order.by=as.Date(df[,1]))

#  create data for example problem
#  remove following statements to process input data
  set.seed(123)
  precip_data <- zoo(5*rexp(365*76, 100), seq(start(precip_data), by="day", length.out=365*76))
  precip_data[as.integer(365*76*runif(10000))] <- NA
#
#  calculate start and end dates of years used to accumulate data
#
  yr_start <- as.numeric( format( start(precip_data),"%Y"))
  if( start(precip_data) < as.Date(paste(yr_start,"-07-01",sep=""))) yr_start <- yr_start-1
  yr_start <- as.Date(paste(yr_start, "-07-01",sep=""))
  yr_end <- as.numeric( format( end(precip_data),"%Y"))
  if( end(precip_data) > as.Date(paste(yr_end,"-07-01",sep=""))) yr_end <- yr_end + 1
  yr_end <- as.Date(paste(yr_end, "-07-01",sep=""))
  yr_seq <- seq(yr_start, yr_end, by="year")
#
#  replace NA's with zeroes
  precip_data_zeroes <- precip_data
  precip_data_zeroes[is.na(precip_data)] <- 0
#  accumulate precipitation for each year and then divide by end of year value to compute percentages
  cum_precip_list <- tapply(precip_data_zeroes, cut(index(precip_data_zeroes), yr_seq), cumsum)
#  list of precipitation percents by year
  cum_precip_pct <- sapply(cum_precip_list, function(x) 100*x/as.numeric(tail(x,1)))
#  zoo daily time series of precipation percents for all years
  cum_precip_zoo <- do.call(rbind, cum_precip_pct)
#  add a column with cummulative percents to original data
  precip_data <- merge(precipitation=precip_data, cum_pct=cum_precip_zoo)
#  save precipitation data and cummulative percents as a csv file
  write.zoo(precip_data, file="precip_data.csv", index.name="Date", sep=",")

#  set the number of plots per page
  plots_per_pg <- 3
  par(mfcol=c(plots_per_pg,1))
#  set the number of years per plot
  yrs_per_plot <- 10
  num_yr <- length(cum_precip_pct)
  num_plts <- ceiling(num_yr/yrs_per_plot)
  for(i_plt in 1:num_plts) {
    i_yr <- (i_plt-1)*yrs_per_plot+1
    i_yr_end <- min((i_yr+yrs_per_plot-1), num_yr)
    plot(cum_precip_pct[[i_yr]], xlim= c(yr_seq[i_yr], yr_seq[i_yr_end+1]),
         xlab="Year", ylab="Cummulative Precipitation (%)", cex.lab=1.4, cex.axis=1.3, xaxt="n")
    axis(side=1, at=yr_seq[i_yr:(i_yr_end+1)], labels=yr_seq[i_yr:(i_yr_end+1)], cex.axis=1.3)
    lapply((i_yr+1):i_yr_end, function(x) lines(cum_precip_pct[[x]]))
}cum_precip_pct包含累积百分比,作为每年zoo时间序列的R列表。precip_data的第一列包含原始降水数据,在第二列中包含整个期间的累积百分比。
更新
对上面的代码进行了修改,将NA替换为零,将累积百分比数据作为一列添加到原始降水数据中,并将其作为csv文件保存到磁盘中。
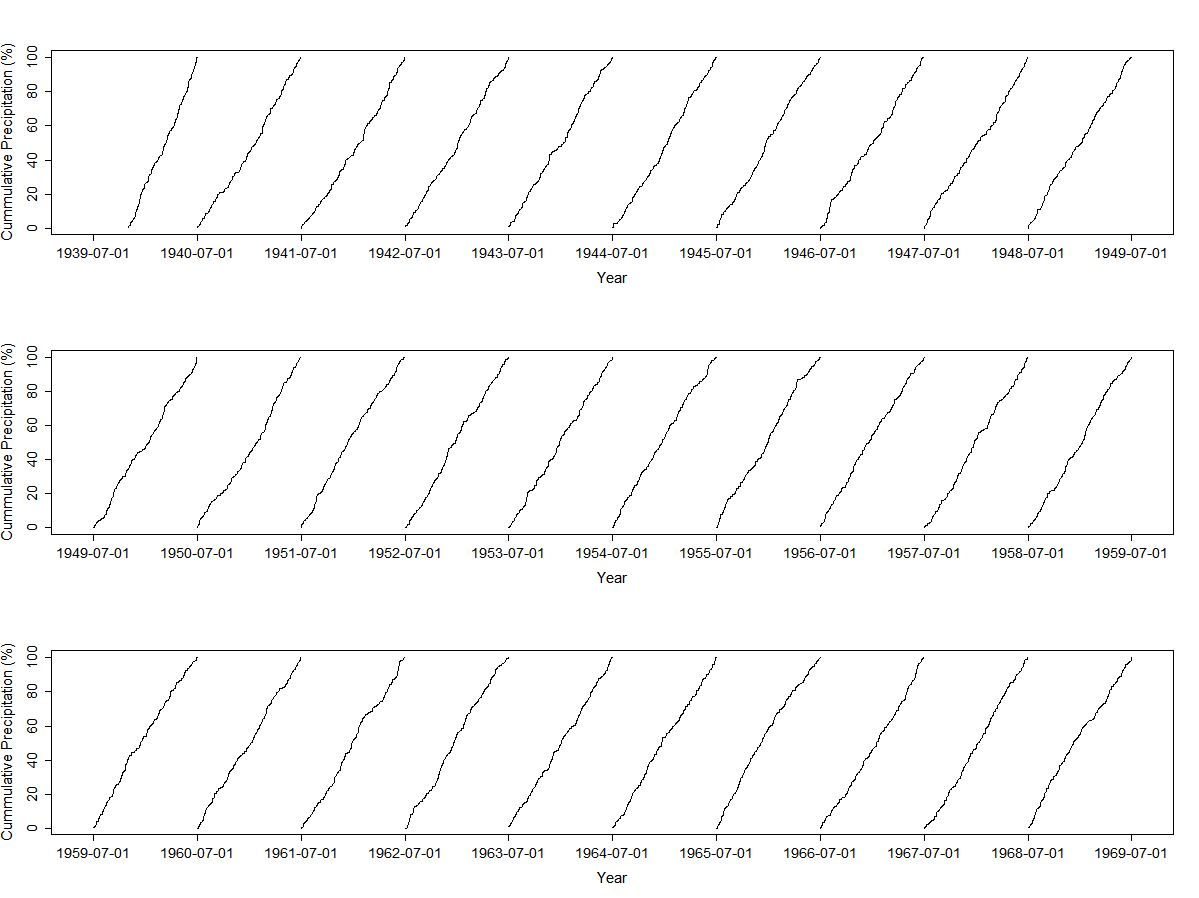
我不清楚你的阴谋意图。把七十个年左右的日常数据放在一个地块里,每年的数据和一年一次的数据非常相似,但并没有显示出多少细节。作为一种更灵活的选择,代码现在可以在一个图上显示多年的数据,每页有几幅图。每页的地块数设置为3,每块地块的年数设置为10,但您可以根据需要更改这些图幅。下面是这些地块的一个例子。
https://stackoverflow.com/questions/31001661
复制相似问题
腾讯云开发者

Copyright © 2013 - 2026 Tencent Cloud. All Rights Reserved. 腾讯云 版权所有
深圳市腾讯计算机系统有限公司 ICP备案/许可证号:粤B2-20090059 ![]() 粤公网安备44030502008569号
粤公网安备44030502008569号
腾讯云计算(北京)有限责任公司 京ICP证150476号 | 京ICP备11018762号