
每幅geom_vlines多行vline
每幅geom_vlines多行vline
提问于 2015-06-14 13:58:52
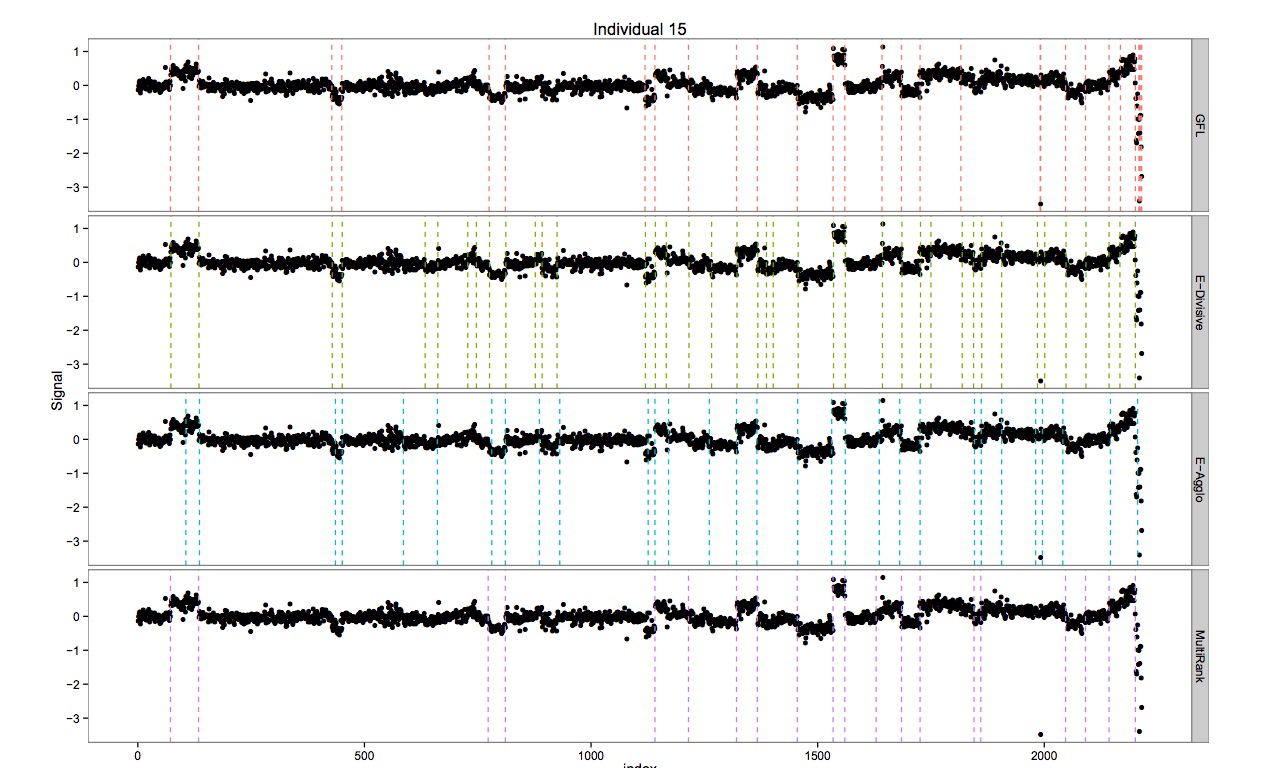
我如何才能获得ggplot来产生类似的东西
library(ggplot2)
library(reshape2)
library(ecp)

synthetic_control.data <- read.table("/path/synthetic_control.data.txt", quote="\"", comment.char="")
n <- 2

s <- sample(1:100, n)
idx <- c(s, 100+s, 200+s, 300+s, 400+s, 500+s)
sample2 <- synthetic_control.data[idx,]
df = as.data.frame(t(as.matrix(sample2)))

#calculate the change points
changeP <- e.divisive(as.matrix(df[1]), k=8, R = 400, alpha = 2, min.size = 3)
changeP = changeP$estimates
changeP = changeP[-c(1,length(changeP))]

changePoints = data.frame(changeP,variable=colnames(df)[1])
for(series in 2:ncol(df)){
  changeP <- e.divisive(as.matrix(df[series]), k=8, R = 400, alpha = 2, min.size = 3)
  changeP = changeP$estimates
  changeP = changeP[-c(1,length(changeP))]
  changePoints = rbind(changePoints, data.frame(changeP,variable=colnames(df)[2]))
}
这是情节有趣的部分:
df$id = 1:nrow(df) dfMelt <- repe2::熔融(df,id.vars = "id") p= ggplot(dfMelt,aes(x=id,y=value))+geom_line(color = "steelblue")+ facet_grid(可变~ .,尺度= 'free_y') p+ geom_vline(aes(xintercept=changeP),data=changePoints,线型=‘虚空’)
到目前为止,我的结果是:https://www.dropbox.com/s/mysadkruo946oox/changePoint.pdf,这意味着传递给geom_vlines的数组有问题。
你能给我指出正确的方向吗?为什么我只在前两个情节中得到vlines?
回答 1
Stack Overflow用户
回答已采纳
发布于 2015-06-14 19:41:21
这就是解决办法:
library(ggplot2)
library(reshape2)
library(ecp)

synthetic_control.data <- read.table("/Users/geoHeil/Dropbox/6.Semester/BachelorThesis/rResearch/data/synthetic_control.data.txt", quote="\"", comment.char="")
n <- 2

s <- sample(1:100, n)
idx <- c(s, 100+s, 200+s, 300+s, 400+s, 500+s)
sample2 <- synthetic_control.data[idx,]
df = as.data.frame(t(as.matrix(sample2)))

#calculate the change points
changeP <- e.divisive(as.matrix(df[1]), k=8, R = 400, alpha = 2, min.size = 3)
changeP = changeP$estimates
changeP = changeP[-c(1,length(changeP))]

changePoints = data.frame(changeP,variable=colnames(df)[1])
for(series in 2:ncol(df)){
  changeP <- e.divisive(as.matrix(df[series]), k=8, R = 400, alpha = 2, min.size = 3)
  changeP = changeP$estimates
  changeP = changeP[-c(1,length(changeP))]
  changePoints = rbind(changePoints, data.frame(changeP,variable=colnames(df)[series]))
}

# plot
df$id = 1:nrow(df)
dfMelt <- reshape2::melt(df, id.vars = "id")
p = ggplot(dfMelt,aes(x=id,y=value))+geom_line(color = "steelblue")+ facet_grid(variable ~ ., scales = 'free_y')
p + geom_vline(aes(xintercept=changeP), data=changePoints, linetype='dashed', colour='darkgreen')页面原文内容由Stack Overflow提供。腾讯云小微IT领域专用引擎提供翻译支持
原文链接:
https://stackoverflow.com/questions/30830247
复制相关文章
相似问题
腾讯云开发者

Copyright © 2013 - 2026 Tencent Cloud. All Rights Reserved. 腾讯云 版权所有
深圳市腾讯计算机系统有限公司 ICP备案/许可证号:粤B2-20090059 ![]() 粤公网安备44030502008569号
粤公网安备44030502008569号
腾讯云计算(北京)有限责任公司 京ICP证150476号 | 京ICP备11018762号