
“预测分析建模技术”中的基本绘图
我试图绘制x和y对,如下所示。有人能给我提供绘制x1,y1的基本代码吗?我尝试了很多东西来包括plot(x1,y1),但是它没有识别这些变量。
 # The Anscsombe Quartet in R

# demonstration data from
# Anscombe, F. J. 1973, February. Graphs in statistical analysis.
#  The American Statistician 27: 17â21.

# define the anscombe data frame
anscombe <- data.frame(
   x1 = c(10, 8, 13, 9, 11, 14, 6, 4, 12, 7, 5),
   x2 = c(10, 8, 13, 9, 11, 14, 6, 4, 12, 7, 5),
   x3 = c(10, 8, 13, 9, 11, 14, 6, 4, 12, 7, 5),
   x4 = c(8, 8, 8, 8, 8, 8, 8, 19, 8, 8, 8),
   y1 = c(8.04, 6.95,  7.58, 8.81, 8.33, 9.96, 7.24, 4.26,10.84, 4.82, 5.68),
   y2 = c(9.14, 8.14,  8.74, 8.77, 9.26, 8.1, 6.13, 3.1,  9.13, 7.26, 4.74),
   y3 = c(7.46, 6.77, 12.74, 7.11, 7.81, 8.84, 6.08, 5.39, 8.15, 6.42, 5.73),
   y4 = c(6.58, 5.76,  7.71, 8.84, 8.47, 7.04, 5.25, 12.5, 5.56, 7.91, 6.89))

# show results from four regression analyses
with(anscombe, print(summary(lm(y1 ~ x1))))
with(anscombe, print(summary(lm(y2 ~ x2))))
with(anscombe, print(summary(lm(y3 ~ x3))))
with(anscombe, print(summary(lm(y4 ~ x4))))

# place four plots on one page using standard R graphics
# ensuring that all have the same scales
# for horizontal and vertical axes
pdf(file = "fig_more_anscombe.pdf", width = 8.5, height = 8.5)
par(mfrow=c(2,2),mar=c(3,3,3,1))
with(anscombe, plot(x1, y1, xlim=c(2,20),ylim=c(2,14),
  pch = 19, col = "darkblue", cex = 2, las = 1)
title("Set I")
with(anscombe,plot(x2, y2, xlim=c(2,20),ylim=c(2,14),
  pch = 19, col = "darkblue", cex = 2, las = 1))
title("Set II")
with(anscombe,plot(x3, y3, xlim=c(2,20),ylim=c(2,14),
  pch = 19, col = "darkblue", cex = 2, las = 1))
title("Set III")
with(anscombe,plot(x4, y4, xlim=c(2,20),ylim=c(2,14),
  pch = 19, col = "darkblue", cex = 2, las = 1))
title("Set IV")
dev.off()

par(mfrow=c(1,1),mar=c(5.1, 4.1, 4.1, 2.1))  # return to plotting defaults

# suggestions for the student
# see if you can develop a quartet of your own
# or perhaps just a duet...
# two very different data sets with the same fitted model回答 2
Stack Overflow用户
发布于 2015-06-07 19:26:44
注意,anscombe数据集随R一起出现,不需要定义。
下面的代码为绘图设置了一个2x2网格,然后计算x和y变量的总体范围。然后,对于i= 1,2,3,4,它创建ith公式,并使用计算的范围绘制它。as.roman用于获取标题的罗马数字部分。然后进行线性回归。我们本可以编写fm <- lm(fo, anscombe)来计算回归,但是如果我们这样做,print(summary(fm))输出就会显示出fo作为公式,这个公式不是很好。最后,利用abline绘制回归曲线,并打印总结。
试试这个:
par(mfrow = c(2,2))

xrange <- range(anscombe[1:4])
yrange <- range(anscombe[5:8])

for(i in 1:4) {
  fo <- as.formula( sprintf("y%d ~ x%d", i, i) )
  plot(fo, anscombe, xlim = xrange, ylim = yrange, main = paste("Set", as.roman(i)))
  fm <- do.call("lm", list(fo, quote(anscombe)))
  abline(fm)
  print( summary(fm) )
}

par(mfrow = c(1,1))给出此图(未显示来自print(summary(...))的输出):
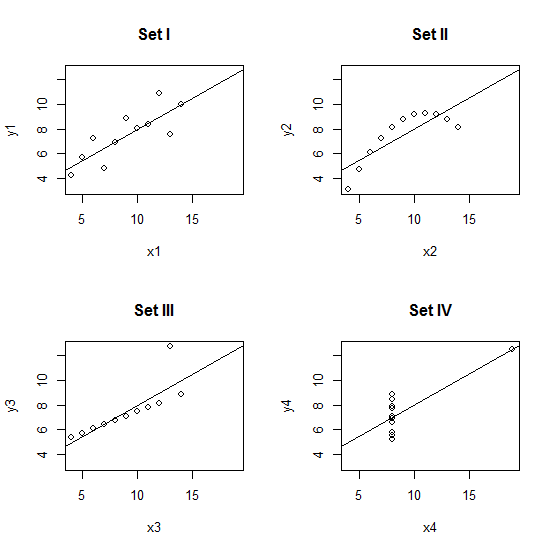
Stack Overflow用户
发布于 2015-06-07 19:20:39
如果您只想做图x1和y1,请尝试:
plot(anscombe$x1,anscombe$y1)或者(从您的代码):
with(anscombe, plot(x1, y1, xlim=c(2,20),ylim=c(2,14),
  pch = 19, col = "darkblue", cex = 2, las = 1)
上面的代码将它们绘制成一个pdf文件,从下面一行开始:
pdf(file = "fig_more_anscombe.pdf", width = 8.5, height = 8.5)直到您在以下位置终止pdf,才能结束:
dev.off()如果不终止pdf,则永远不会在R中看到绘图输出。如果您多次运行代码,请通过运行以下命令确保没有打开pdf设备:
dev.off()直到你看到:
Error in dev.off() : cannot shut down device 1 (the null device)https://stackoverflow.com/questions/30697304
复制相似问题
腾讯云开发者

Copyright © 2013 - 2026 Tencent Cloud. All Rights Reserved. 腾讯云 版权所有
深圳市腾讯计算机系统有限公司 ICP备案/许可证号:粤B2-20090059  粤公网安备44030502008569号
腾讯云计算(北京)有限责任公司 京ICP证150476号 | 京ICP备11018762号