
如何不绘制多行图形?
如何不绘制多行图形?
提问于 2015-06-06 02:12:16
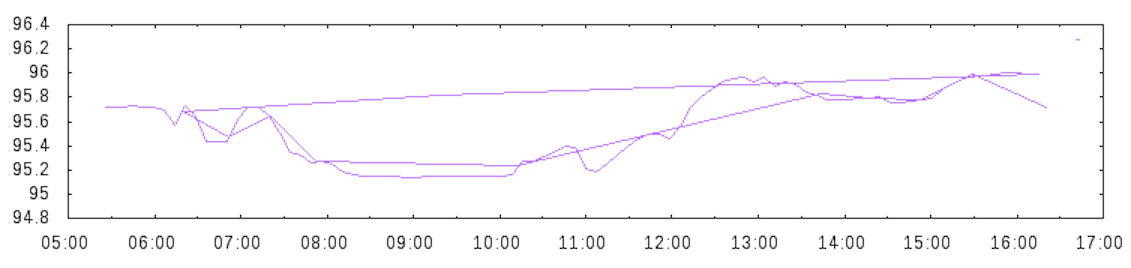
我正在绘制一些数据,我得到了多条线在地块上裸奔。应该有一行,所以我想gnuplot正在尝试拟合数据,并以一种奇怪的方式连接点或其他东西。我怎样才能得到一个图形来绘制一个类似的,而不是多行?这是我的剧本:
set term png font 'Liberation Sans,10' size 800,200
set output "data/values.png"
set style line 1 lt 1 lw 1 lc rgb "purple" pt -1
set xlabel "Time" font 'Liberation Sans,10'
set xdata time
set timefmt "%Y-%m-%d %H:%M:%S"
set xtics font 'Liberation Sans,10'
set ytics font 'Liberation Sans,10'
set autoscale y
plot "data.txt" using 1:5 ls 1 smooth bezier with lines
回答 1
Stack Overflow用户
回答已采纳
发布于 2015-06-07 21:22:50
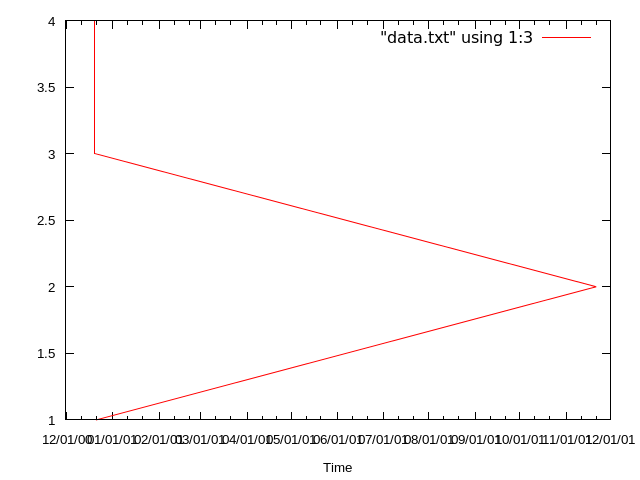
您可以使用sort对数据进行排序。考虑我生成的与您的时间格式一致的下列数据文件:
2000-12-21 12:32:05 1
2001-11-21 12:32:05 2
2000-12-20 12:32:05 3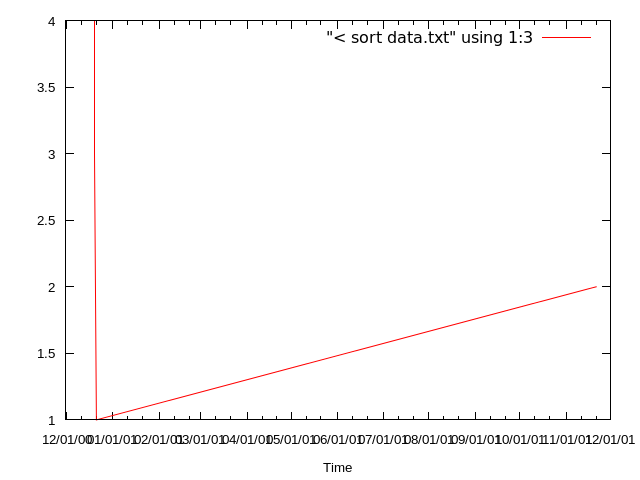
2000-12-20 12:32:04 4键入sort data.txt将得到正确的排序:
2000-12-20 12:32:04 4
2000-12-20 12:32:05 3
2000-12-21 12:32:05 1
2001-11-21 12:32:05 2通过使用特殊的输入名plot "< sort data.txt" ...,可以在gnuplot中调用此命令。
set xdata time
set timefmt "%Y-%m-%d %H:%M:%S"
plot "data.txt" using 1:3 w l
set xdata time
set timefmt "%Y-%m-%d %H:%M:%S"
plot "< sort data.txt" using 1:3 w l
如果需要对数据格式进行更强大的排序,可以参考sort文档。
页面原文内容由Stack Overflow提供。腾讯云小微IT领域专用引擎提供翻译支持
原文链接:
https://stackoverflow.com/questions/30678264
复制相关文章
相似问题
腾讯云开发者

Copyright © 2013 - 2026 Tencent Cloud. All Rights Reserved. 腾讯云 版权所有
深圳市腾讯计算机系统有限公司 ICP备案/许可证号:粤B2-20090059 ![]() 粤公网安备44030502008569号
粤公网安备44030502008569号
腾讯云计算(北京)有限责任公司 京ICP证150476号 | 京ICP备11018762号