
带有matplotlib/basemap的Python插值
带有matplotlib/basemap的Python插值
提问于 2015-05-28 15:18:55
我对编程很陌生,很难理解插值。我发现每个试图解释它的源都非常神秘(特别是basemap/matplotlib的包特定站点)。我正在使用matplotlib的basemap进行映射,但是我的数据的本质是它是5度乘5度的块(lat块)。我想通过插值把地图平滑。
首先这是我的密码。
from netCDF4 import Dataset
import numpy as np
import matplotlib.pyplot as plt
from mpl_toolkits.basemap import Basemap, addcyclic

#load the netcdf file into a variable
mar120="C:/Users/WillEvo/Desktop/sec_giptie_cpl_mar_120.nc"

#grab the data into a new variable
fh=Dataset(mar120,mode="r")

#assign model variable contents to python variables
lons=fh.variables['lon'][:]
lats=fh.variables['lat'][:]
test=fh.variables['NE'][:]

#specifying which time and elevation to map
ionst=test[12,0]

#close the netCDF file
fh.close()

# get rid of white stripe on map
ionst, lons=addcyclic(ionst, lons)

#map settings
m=Basemap(llcrnrlon=-180, llcrnrlat=-87.5, urcrnrlon=180, urcrnrlat=87.5,rsphere=6467997, resolution='i', projection='cyl',area_thresh=10000, lat_0=0, lon_0=0)

#Creating 2d array of latitude and longitude
lon, lat=np.meshgrid(lons, lats)
xi, yi=m(lon, lat)

#setting plot type and which variable to plot
cs=m.pcolormesh(xi,yi,np.squeeze(ionst))

#drawing grid lines
m.drawparallels(np.arange(-90.,90.,30.),labels=[1,0,0,0],fontsize=10)
m.drawmeridians(np.arange(-180.,181.,30.), labels=[0,0,0,1],fontsize=10)

#drawing coast lines
m.drawcoastlines()

#color bar
cbar=m.colorbar(cs, location='bottom', pad="10%")
cbar.set_label("Elecron Density cm-3")

#showing the plot
plt.show()
那么现在,我怎样才能轻易地插值我的数据来平滑它呢?但是,我试图调用Basemap.interp,但是说basemap没有属性interp是错误的。
我对我用来插值数据的东西非常公正,我真的需要有人向我解释这件事,就像我是个傻瓜一样。
也请注意,我正在学习地图,所以细节,如标签和诸如此类,我不太担心到目前为止。下面是上面的代码输出的示例映射。
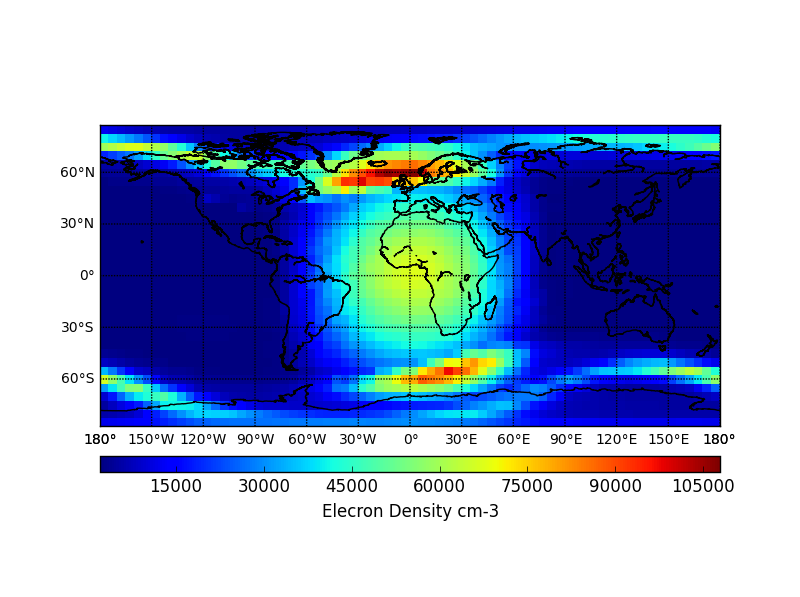
回答 2
Stack Overflow用户
回答已采纳
发布于 2015-05-28 15:38:50
为了使事情顺利进行,我会使用imshow而不是pcolormesh。
例如:
from pylab import *

data = random((3,3))
figure(1)
imshow(data, interpolation='none')

plt.show()
给予:
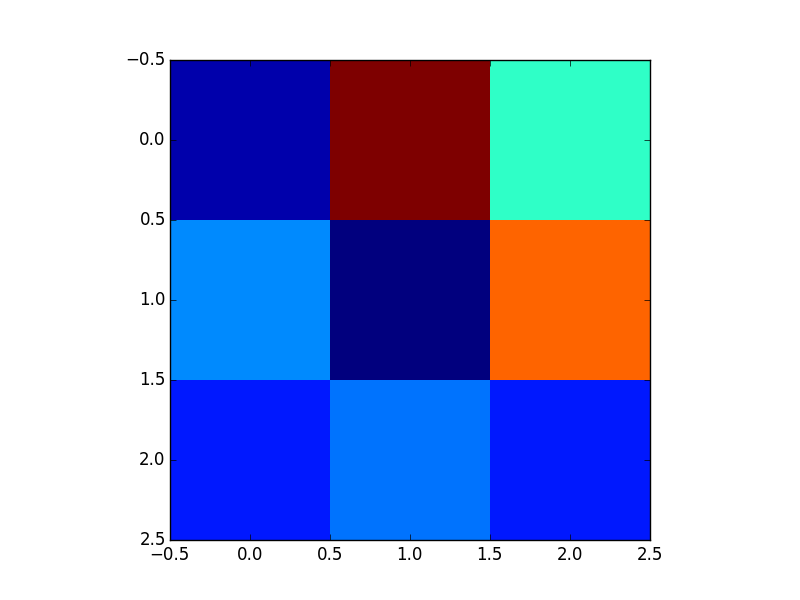
和
imshow(data, interpolation='bicubic')给予:
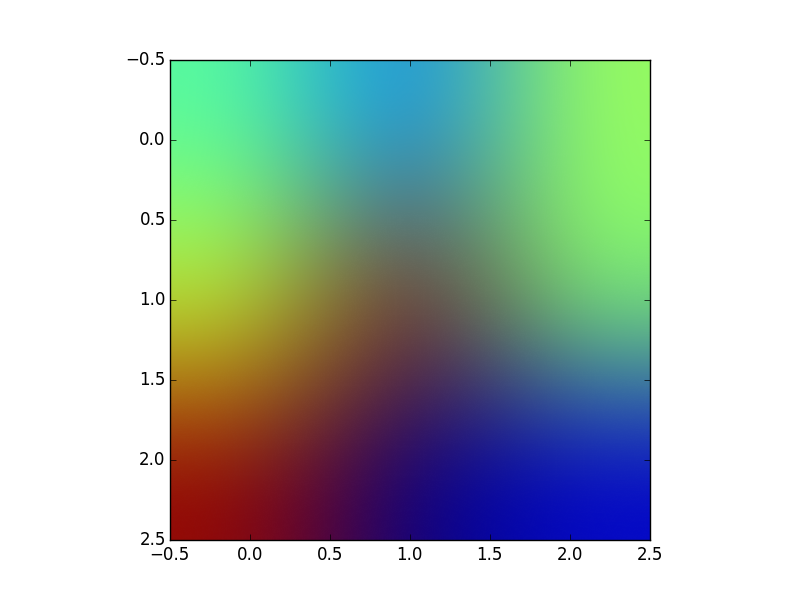
帮助页给出了所有可能的插值列表:api.html#matplotlib.pyplot.imshow
Stack Overflow用户
发布于 2017-09-19 18:28:46
这包含了一些额外的代码,但这就是我认为我最终得到的结果。这是几年前的事了,所以我不能百分之百确定这是解决我答案的上面的确切代码。
from netCDF4 import Dataset
import numpy as np
import matplotlib.pyplot as plt
from mpl_toolkits.basemap import Basemap, addcyclic
import matplotlib.animation as animation

plt.rcParams['animation.ffmpeg_path'] = 'C:/FFMPEG/bin/ffmpeg'

file_loc = "C:/Users/Will Evonosky/Dropbox/SOARS/SOARS 2015/Data"
#load the netcdf file into a variable
mar120=file_loc+"/My Datasets To Share/SA120_Iono_Acc_WE.nc"

#grab the data into a new variable
fh=Dataset(mar120,mode="r")

#assign model variable contents to python variables
lons=fh.variables['lon'][:]
lats=fh.variables['lat'][:]
var1=fh.variables['GT'][:]

#specifying which time and elevation to map
ionst=var1[0,18,:,:]
details='(Z=6)'

#close the netCDF file
fh.close()


# get rid of white stripe on map
ionst, lons=addcyclic(ionst, lons)

#Setting figure attributes
fig=plt.figure(figsize=(15,15),frameon=False)

#map settings
m=Basemap(llcrnrlon=-180, llcrnrlat=-87.5, urcrnrlon=180, urcrnrlat=87.5,rsphere=6467997, resolution='l', projection='cyl',area_thresh=10000, lat_0=0, lon_0=0)

#Creating 2d array of latitude and longitude
lon, lat=np.meshgrid(lons, lats)
xi, yi=m(lon, lat)

#plotting data onto basemap
cs=m.imshow(ionst, interpolation=None, alpha=.8)
vert=plt.axvline(x=-75, color='black', linewidth=5)
#drawing grid lines
m.drawparallels(np.arange(-90.,90.,30.),labels=[1,0,0,0],fontsize=15)
m.drawmeridians(np.arange(-180.,181.,30.), labels=[0,0,0,1],fontsize=15)

#drawing coast lines
m.drawcoastlines()

#color bar
cbar=m.colorbar(cs, location='bottom', pad="10%")
cbar.set_label(r"Ion Drag $(cm/s^2)$", size=15)

#Title Preferences
plt.title('Ion Drag at '+details, size=25)


#Function to update the plots data
def updateax1(j):
    cs.set_array(var1[j,18,:,:])
    return cs,

#Animate the plot
ani1=animation.FuncAnimation(fig, updateax1, frames=range(24), interval=250, blit=True)
ani1.save('Iondrag_Map.mp4')

#showing the plot
plt.show()页面原文内容由Stack Overflow提供。腾讯云小微IT领域专用引擎提供翻译支持
原文链接:
https://stackoverflow.com/questions/30510663
复制相关文章
相似问题
腾讯云开发者

Copyright © 2013 - 2026 Tencent Cloud. All Rights Reserved. 腾讯云 版权所有
深圳市腾讯计算机系统有限公司 ICP备案/许可证号:粤B2-20090059 ![]() 粤公网安备44030502008569号
粤公网安备44030502008569号
腾讯云计算(北京)有限责任公司 京ICP证150476号 | 京ICP备11018762号