
如何使用ggbiplot使双情节名称更加清晰
如何使用ggbiplot使双情节名称更加清晰
提问于 2015-05-27 15:34:09
我有一个数据可以从这里下载https://gist.github.com/anonymous/5f1135e4f750a39b0255
我尝试使用以下函数绘制带有ggbiplot的PCA
data <- read.delim("path to the data.txt")
data.pca <- prcomp (data, center = TRUE, scale =TRUE)
library(ggbiplot)
g <- ggbiplot(data.pca, obs.scale =1, var.scale=1, ellipse = TRUE, circle=TRUE)
g <- g + scale_color_discrete(name='')
g <- g + theme(legend.direction = 'horizontal', legend.position = 'top')
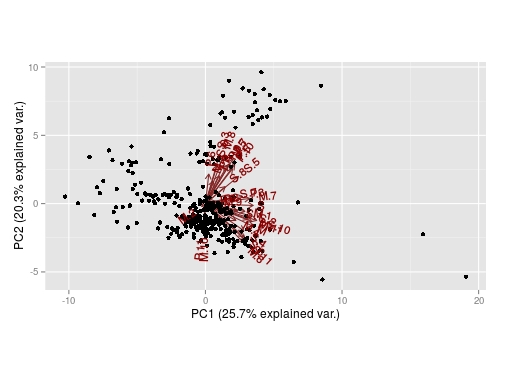
print(g)但是,很难看到双情节线的名字,
有什么办法让它更清楚或者更好地展示出来吗?
回答 1
Stack Overflow用户
回答已采纳
发布于 2015-05-27 22:28:33
我认为让它更清晰的一种方法是使用varname.size和varname.adjust参数来调整标签的大小和位置。然而,有很多变量,它看起来仍然很拥挤。通过增加箭头的长度(类似于stats::biplot()),使它看起来更好看(imo)
# install ggbiplot
#require(devtools)
#install_github('ggbiplot','vqv')
library(httr)
library(ggbiplot)
# read data
url <- "https://gist.githubusercontent.com/anonymous/5f1135e4f750a39b0255/raw/data.txt"
dat <- read.table(text=content(GET(url), as="text"), header=TRUE)
# pca
data.pca <- prcomp (dat, center = TRUE, scale =TRUE)
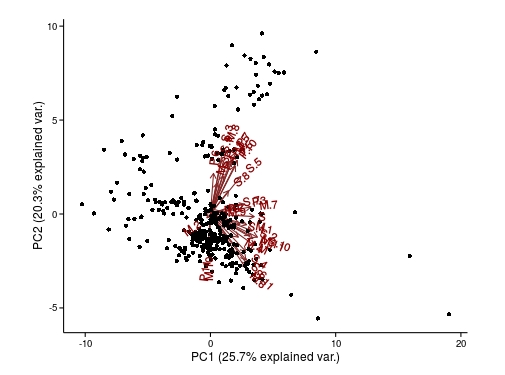
# original plot + increase labels size and space from line
p <- ggbiplot(data.pca, obs.scale=1,
var.scale=1, circle=F,
varname.size=4, varname.adjust=2)
p
# use coord_equal() to change size ratio of plot (excludes use of circle)
p <- p + coord_equal(1.5) + theme_classic()
p
要扩展箭头,需要重新计算x和y坐标。然后您可以使用这些来编辑相关的grobs,并更改任何其他参数(颜色、大小、旋转等)。(您可以使用整个ggplotGrob(p)方法,但只需在下面使用grid.edit()。)
# function to rescale the x & y positions of the lines and labels
f <- function(a0, a1, M=M)
      {
      l <- lapply(as.list(environment()), as.numeric)
      out <- M* (l$a1 - l$a0) + l$a0
      grid::unit(out, "native")
      }

# get list of grobs in current graphics window
grobs <- grid.ls(print=FALSE)

# find segments grob for the arrows
s_id <- grobs$name[grep("segments", grobs$name)]

# edit length and colour of lines
seg <- grid.get(gPath(s_id[2]))
grid.edit(gPath(s_id[2]),
            x1=f(seg$x0, seg$x1, 2),
            y1=f(seg$y0, seg$y1, 2),
            gp=gpar(col="red"))


# find text grob for the arrow labels
lab_id <- grobs$name[grep("text", grobs$name)]

# edit position of text, and rotate and colour labels
seg2 <- grid.get(gPath(lab_id))
grid.edit(gPath(lab_id),
            x=f(seg$x0, seg2$x, 2),
            y=f(seg$y0, seg2$y, 2),
            rot=0,
            gp=gpar(col="red"))
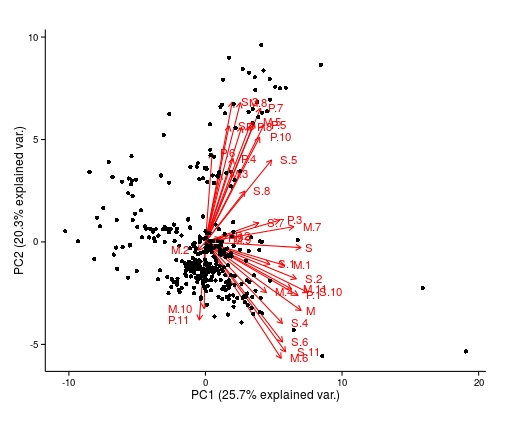
主观的,如果这使它更好,也许它更容易使用biplot(),甚至定义一个新的函数
页面原文内容由Stack Overflow提供。腾讯云小微IT领域专用引擎提供翻译支持
原文链接:
https://stackoverflow.com/questions/30486976
复制相关文章
相似问题
腾讯云开发者

Copyright © 2013 - 2026 Tencent Cloud. All Rights Reserved. 腾讯云 版权所有
深圳市腾讯计算机系统有限公司 ICP备案/许可证号:粤B2-20090059 ![]() 粤公网安备44030502008569号
粤公网安备44030502008569号
腾讯云计算(北京)有限责任公司 京ICP证150476号 | 京ICP备11018762号