
在matlab中计算S变换及其平方值
在matlab中计算S变换及其平方值
提问于 2015-05-13 05:05:16
让我们考虑以下代码
要计算S变换,下面是我的代码
function ST=stran(h)
% Compute S-Transform without for loops
%%% Coded by Kalyan S. Dash %%%
%%% IIT Bhubaneswar, India %%%
[~,N]=size(h); % h is a 1xN one-dimensional series
nhaf=fix(N/2);
odvn=1;
if nhaf*2==N;
    odvn=0;
end
f=[0:nhaf -nhaf+1-odvn:-1]/N;
Hft=fft(h);
%Compute all frequency domain Gaussians as one matrix
invfk=[1./f(2:nhaf+1)]';
W=2*pi*repmat(f,nhaf,1).*repmat(invfk,1,N);
G=exp((-W.^2)/2); %Gaussian in freq domain
% End of frequency domain Gaussian computation
% Compute Toeplitz matrix with the shifted fft(h)
HW=toeplitz(Hft(1:nhaf+1)',Hft);
% Exclude the first row, corresponding to zero frequency
HW=[HW(2:nhaf+1,:)];
% Compute Stockwell Transform
ST=ifft(HW.*G,[],2); %Compute voice
%Add the zero freq row
st0=mean(h)*ones(1,N);

ST=[st0;ST];

end
并考虑跟踪啁啾信号
>> t = 0:0.001:2;
x = chirp(t,100,1,200,'quadratic');
我需要确认我做的是正确的
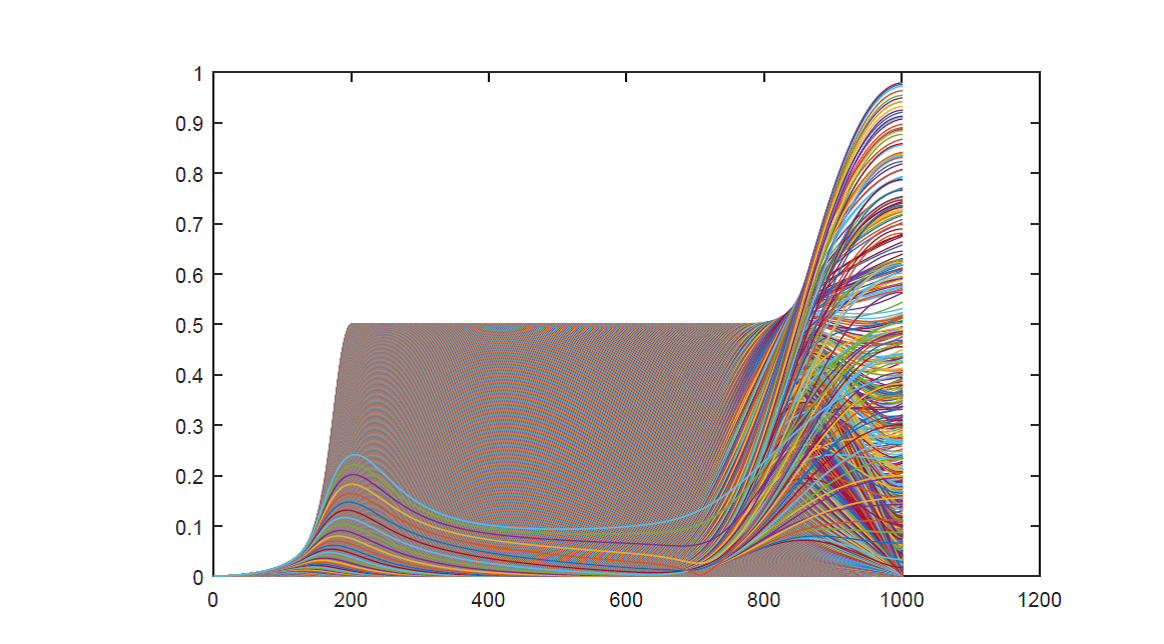
>> ST=stran(x);
>> plot(abs(ST))
图片在这里
回答 1
Stack Overflow用户
回答已采纳
发布于 2015-05-13 09:49:01
张贴我的评论作为回答:
我对s变换不太了解,但AFAIK的结果是一个3D信号(正如您可以清楚地看到ST的大小),所以您可能想做imagesc(abs(ST))或surf(abs(ST),'linestyle','none')而不是绘图。
在你的数字中,你画了1000条线,这就是为什么它如此混乱的原因。
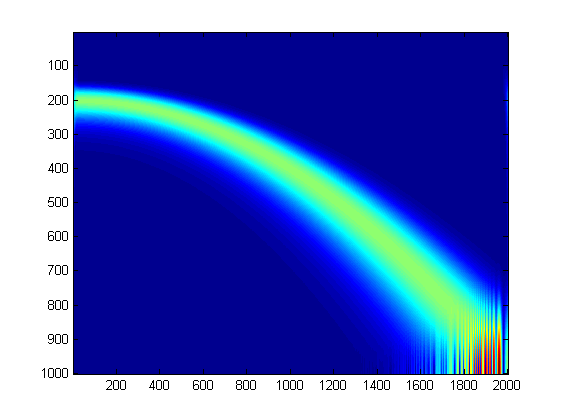
使用
imagesc(abs(ST))
页面原文内容由Stack Overflow提供。腾讯云小微IT领域专用引擎提供翻译支持
原文链接:
https://stackoverflow.com/questions/30206097
复制相关文章
相似问题
腾讯云开发者

Copyright © 2013 - 2026 Tencent Cloud. All Rights Reserved. 腾讯云 版权所有
深圳市腾讯计算机系统有限公司 ICP备案/许可证号:粤B2-20090059 ![]() 粤公网安备44030502008569号
粤公网安备44030502008569号
腾讯云计算(北京)有限责任公司 京ICP证150476号 | 京ICP备11018762号