
在R中使用用户定义函数中的图例
在R中使用用户定义函数中的图例
提问于 2015-04-30 03:24:45
首先,我对R的认识还处于婴儿阶段,所以如果我遇到无知,请原谅我。
我正在编写一个用户定义的函数,它将R^2和p-值放在一个线性回归的散点图上。以下是目前为止的代码:
stats.insert <- function(data, x, y)
{
reg1<-with(data,lm(y~x))
fit<-abline(reg1, col="blue")
modsum = summary(reg1)
r2=modsum["r.squared"]
my.p <- coef(modsum)[2,4]
rp=vector('expression',2)
rp[1]=substitute(expression(italic(R)^2==MYVALUE),
   list(MYVALUE=format(r2,dig=3)))[2]
rp[2]=substitute(expression(italic(p)== MYOTHERVALUE),
  list(MYOTHERVALUE=format(my.p,digits=2)))[2]
legend("bottomleft",legend=rp,bty='n')
}
这是伟大的,然而,我也想具体的位置的传奇。这个函数应该是这样的:
stats.insert <- function(data, x, y, placement)位置将在图例功能中。我遇到的问题是,我无法绕过传奇函数中的"“。
如有任何建议,将不胜感激。
谢谢!
回答 2
Stack Overflow用户
回答已采纳
发布于 2015-04-30 04:26:37
欢迎来到R和SO。
有许多方法可以创建一个功能,可以很好地满足您的需要。
# Function stats.insert
# Args:
# formula : see ?lm
# data: a data.frame, see ?lm
# ... Arguments passed to the legend() for the plot
#
# Return:
# A plot of the data with the regression line, and the coefficient of
# determination, and a p-value in a legend.
stats.insert <- function(formula, .data, ...) {
reg1 <- lm(formula, data = .data)
modsum <- summary(reg1)
r2 <- format(modsum["r.squared"], digits = 3)
my.p <- format(coef(modsum)[2,4], digits = 2)
rp <- vector('expression', 2)
rp[1] <- substitute(expression(italic(R)^2==MYVALUE),list(MYVALUE=format(r2,dig=3)))[2]
rp[2] <- substitute(expression(italic(p)== MYOTHERVALUE), list(MYOTHERVALUE=format(my.p,digits=2)))[2]
abline(reg1, col="blue")
legend(..., legend = rp, bty = 'n')
}
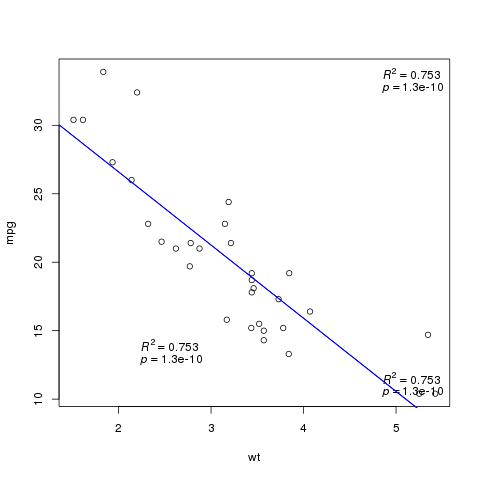
with(mtcars, plot(wt, mpg))
stats.insert(mpg ~ wt, mtcars, "bottomright")
stats.insert(mpg ~ wt, mtcars, "topright")
stats.insert(mpg ~ wt, mtcars, x = 2, y = 15)
Stack Overflow用户
发布于 2015-04-30 03:34:37
怎么回事:
stats.insert <- function(data, x, y,placement="bottomleft")
{

    lots of code ...

    legend(placement,legend=rp,bty='n')
}页面原文内容由Stack Overflow提供。腾讯云小微IT领域专用引擎提供翻译支持
原文链接:
https://stackoverflow.com/questions/29958487
复制相关文章
相似问题
腾讯云开发者

Copyright © 2013 - 2026 Tencent Cloud. All Rights Reserved. 腾讯云 版权所有
深圳市腾讯计算机系统有限公司 ICP备案/许可证号:粤B2-20090059 ![]() 粤公网安备44030502008569号
粤公网安备44030502008569号
腾讯云计算(北京)有限责任公司 京ICP证150476号 | 京ICP备11018762号