
MATLAB新手-在指南中显示面板上的照片
我想在面板上方显示照片,我在这里看到了文档:http://www.mathworks.com/help/matlab/ref/uistack.html,但它只在图中提到如何使用这个函数(uistack)。
我的节目到现在为止:
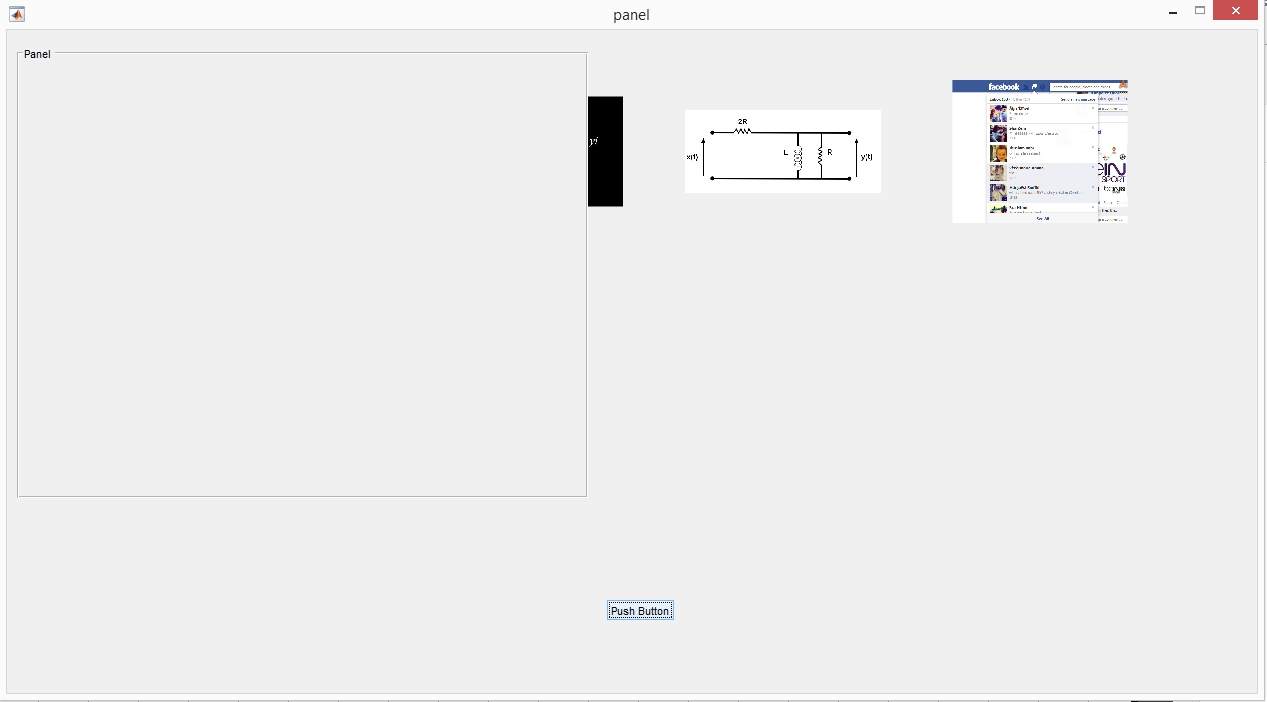
我的代码:
function varargout = panel(varargin)

gui_Singleton = 1;
gui_State = struct('gui_Name',       mfilename, ...
                   'gui_Singleton',  gui_Singleton, ...
                   'gui_OpeningFcn', @panel_OpeningFcn, ...
                   'gui_OutputFcn',  @panel_OutputFcn, ...
                   'gui_LayoutFcn',  [] , ...
                   'gui_Callback',   []);
if nargin && ischar(varargin{1})
    gui_State.gui_Callback = str2func(varargin{1});
end

if nargout
    [varargout{1:nargout}] = gui_mainfcn(gui_State, varargin{:});
else
    gui_mainfcn(gui_State, varargin{:});
end


handles.output = hObject;


guidata(hObject, handles);


function varargout = panel_OutputFcn(hObject, eventdata, handles)


varargout{1} = handles.output;


function pushbutton1_Callback(hObject, eventdata, handles)

k = 1;
[filename pathname]  = uigetfile({'*.*'},'File Selector','MultiSelect', 'on')
iscellstr(filename)
celldata1 = cellstr(pathname)
celldata2 = cellstr(filename)
celldata3 = strcat(celldata1,celldata2)
subplot(3,4,1),imshow(celldata3{1})
subplot(3,4,2),imshow(celldata3{2})
subplot(3,4,3),imshow(celldata3{3})
subplot(3,4,4),imshow(celldata3{4})
subplot(3,4,5),imshow(celldata3{5})
subplot(3,4,6),imshow(celldata3{6})回答 2
Stack Overflow用户
发布于 2015-04-28 13:21:42
我要求提供该版本的原因是,如果您使用的是旧版本(比R2014b更早),您可以将uipanel的BackgroundColor属性设置为“none”,这将使其透明化。这个“功能”在R2014b上不起作用.
%% Only HG1 (pre R2014b)
f = figure;
subplot ( 3, 3, 4 )
uipanel ( 'parent', f, 'Position', [0. 0. 0.6 0.6], 'BackgroundColor', 'none' );
恐怕其他选项将需要更多关于GUI工作方式的知识--特别是从命令行创建GUI(而不是指南中的):
% Create a figure
f = figure;
% Create a uicontainer (this is a way of grouping controls together
uic = uicontainer ( 'parent', f, 'position', [0.1 0.1 0.5 0.5] );
% Create an axes -> which is a child of the UICONTAINER
ax = axes ( 'parent', uic, 'position', [0 0 1 1] );
% Create a uipanel -> which is a chilf of the FIGURE
uipanel ( 'parent', f, 'position', [0 0 0.4 0.7] );
% Some data to plot
image(rand(100)*255,'parent',ax)
% Note at this point the axes is underneath the uipanel
%%
% Hey presto we can move the uicontainer to the top and the axes appears! :)
uistack ( uic, 'top' )注意:,如果您在创建uipanel之后创建了uicontainer,那么您就不需要使用uistack了--我按这个顺序来显示uistack将按堆栈顺序移动'axes‘.
Stack Overflow用户
发布于 2015-05-03 18:38:31
我不确定我是否正确地解决了你的需要,尽管如此.
您可以首先创建指定其位置(包括大小)的面板(uipanel),然后创建您需要的任意多个轴(考虑要添加的图像数量),以便设置一种棋盘(您可以通过正确设置它们的位置和大小来实现这一点)。
现在可以通过指定parent属性在轴上加载图像。
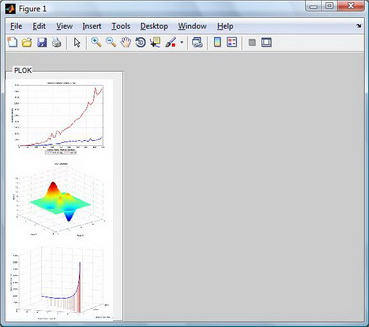
在下面的示例中,我创建了一个uipanel,其中包含三个图像,请注意对imshow的调用中的耦合“属性”。
在代码的"pushbutton1_Callback“中,您可以”自动化“此过程。
uipanel ('position', [0 0 0.33 0.95],'title','PLOK');
a1=axes('position',[0 0 .3 .3])
a2=axes('position',[0 0.3 .3 .3])
a3=axes('position',[0 0.6 .3 .3])

imshow('curva_con_linee_verticali.jpg','parent',a1)
imshow('grafico_3d_assi_cartesiani.jpg','parent',a2)
imshow('prod_punt.jpg','parent',a3)
这就是这个图形的样子(这三个图实际上是三个jpg图像):
希望这能有所帮助。
https://stackoverflow.com/questions/29916080
复制相似问题
腾讯云开发者

Copyright © 2013 - 2026 Tencent Cloud. All Rights Reserved. 腾讯云 版权所有
深圳市腾讯计算机系统有限公司 ICP备案/许可证号:粤B2-20090059 ![]() 粤公网安备44030502008569号
粤公网安备44030502008569号
腾讯云计算(北京)有限责任公司 京ICP证150476号 | 京ICP备11018762号