
用ggmap绘制形状文件:当形状文件大于ggmap时裁剪
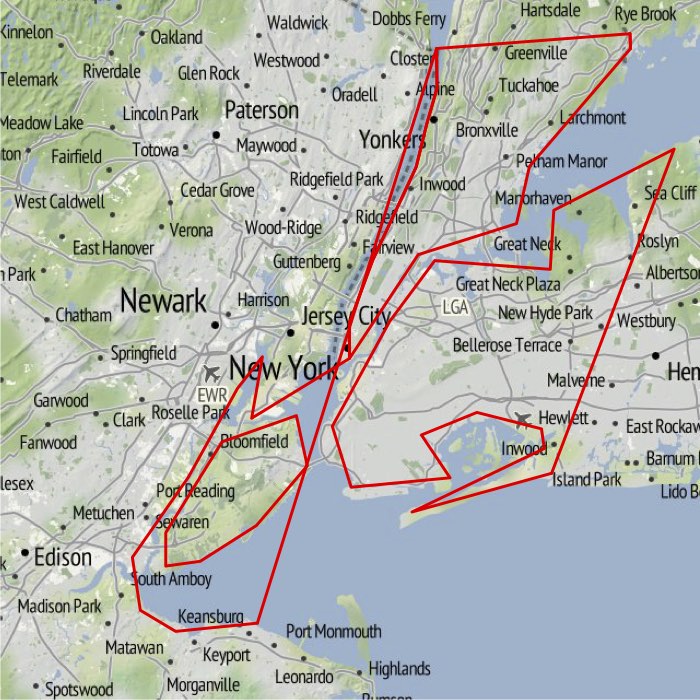
当我尝试将ggmap和形状文件组合在一起时,我遇到了剪裁问题。Kahle和Wickham (2013: 158)的例子很好,因为ggmap的光栅图像覆盖了整个形状文件。下面是一个示例,说明当我试图在一个覆盖较小区域的ggmap绘图上绘制美国各州的形状文件时会发生什么。ggmap显示了纽约市,我想把它与美国各州的边界覆盖起来(举个例子)。得到的地图没有任何意义。问题是,形状文件会被剪裁,ggplot会连接未剪裁的点。下面是密码。形状文件来自这里。我只是在这里展示最后一个情节。
我该如何解决这个问题?
path <- "PATH TO SHAPEFILE"
library("ggmap")
library("rgdal")

# shapefile
states <- readOGR(dsn = path, layer = "states")
states_df <- fortify(states)
# plot shapefile
plot(states, lwd = 0.1)
ggplot(states_df, aes(long, lat, group = group)) +
    geom_polygon(colour = "black", fill = NA, size = 0.1)


# combine ggmap with shapefile
map <- get_map("new york city", zoom = 10, source = "stamen")
ggmap(map, extent = "device")

ggmap(map, extent = "device") +
    geom_polygon(aes(long, lat, group=group), data = states_df, colour = "red", fill = NA, size = 1)
卡尔,大卫和哈德利·韦翰。2013年。Ggmap:使用ggplot2的空间可视化“R日刊”5(1):144-61。
回答 2
Stack Overflow用户
发布于 2015-05-07 23:20:41
这是我的尝试。我经常使用GADM,您可以使用raster包直接导入这些文件。我为NY,NJ和CT细分了形状文件。您可能最终不必这样做,但可能最好减少数据量。当我绘制地图时,ggplot自动移除数据点,这些数据点位于ggmap图像的bbox之外。因此,我无须做任何额外的工作。我不知道你用的是哪种形状文件。但是,GADM的数据似乎能很好地处理ggmap图像。希望这能帮到你。
library(raster)
library(rgdal)
library(rgeos)
library(ggplot2)
### Get data (shapefile)
us <- getData("GADM", country = "US", level = 1)
### Select NY and NJ
states <- subset(us, NAME_1 %in% c("New York", "New Jersey", "Connecticut"))
### SPDF to DF
map <- fortify(states)
## Get a map
mymap <- get_map("new york city", zoom = 10, source = "stamen")
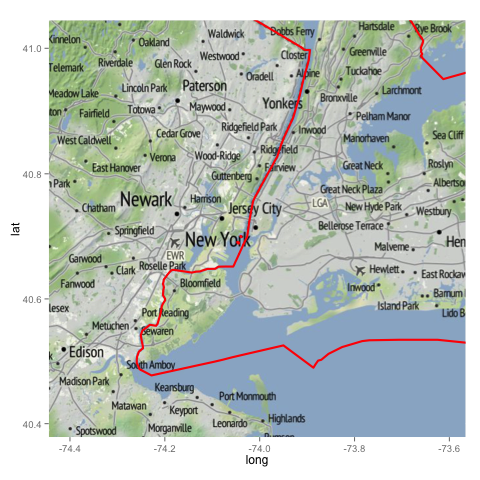
ggmap(mymap) +
geom_map(data = map, map = map, aes(x = long, y = lat, map_id = id, group = group))
如果你只想要行,下面就是你想要的。
ggmap(mymap) +
geom_path(data = map, aes(x = long, y = lat, group = group))
Stack Overflow用户
发布于 2015-05-07 21:50:17
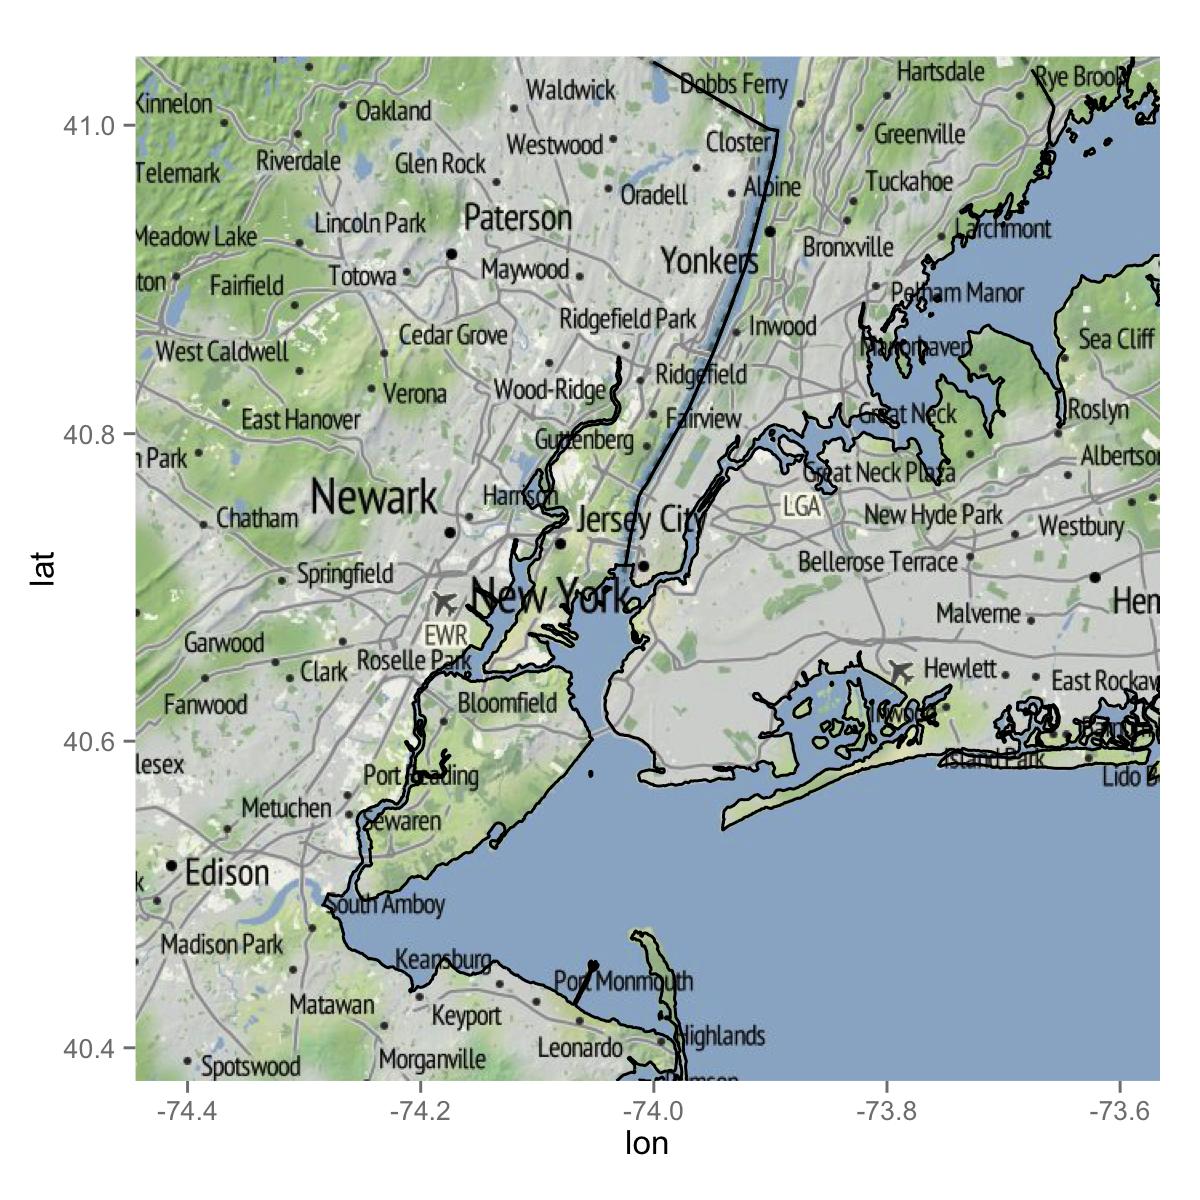
我想看看这个答案,当你放大的时候,ggmap似乎没有以一种理想的方式处理多边形,也就是说,不是在图上的项目会被截断,导致形状文件的“有趣”结果。
多边形在不同缩放级别上很好地裁剪ggplot2 2/ggmap
# transform for good measure
states <- spTransform(states,CRS("+datum=WGS84 +proj=longlat") )

# combine ggmap with shapefile
states_df <- fortify(states)

# get your map
map <-get_map("new york city", zoom = 10, source = "stamen")

a <- ggmap(map, # this is where we get our raster
       base_layer=ggplot(aes(x=long, y=lat), data=states_df), # this defines the region where things are plotted
       extent = "normal",  # this won't work with device, you need normal (see examples in ggmap documentation)
       maprange=FALSE
       ) +
coord_map( # use map's bounding box to setup the 'viewport' we want to see
  projection="mercator",
  xlim= c(attr(map, "bb")$ll.lon, attr(map, "bb")$ur.lon),
  ylim=c(attr(map, "bb")$ll.lat, attr(map, "bb")$ur.lat)
) +
geom_polygon( # plot the polygon
  aes(x=long, y=lat,group=group), data =states_df, color = "red", fill=NA, size = 1)

print(a)
产出:
顺便提一句,你可能想用美国的人口普查数据来查看州地图,这些数据似乎比ESRI数据集的质量更高。
state10.zip
作为最后的说明,在极地附近有ggmap的问题,所以我也会根据您感兴趣的状态来划分您的数据。
https://stackoverflow.com/questions/29825458
复制相似问题
腾讯云开发者

Copyright © 2013 - 2026 Tencent Cloud. All Rights Reserved. 腾讯云 版权所有
深圳市腾讯计算机系统有限公司 ICP备案/许可证号:粤B2-20090059 ![]() 粤公网安备44030502008569号
粤公网安备44030502008569号
腾讯云计算(北京)有限责任公司 京ICP证150476号 | 京ICP备11018762号