
在绘图矩阵函数的图间添加空间
在绘图矩阵函数的图间添加空间
提问于 2015-04-05 20:47:59
有没有办法在plotmatrix函数的图形之间添加一些空间?(我想给每个x和y轴贴上标签)
回答 1
Stack Overflow用户
回答已采纳
发布于 2015-04-14 22:14:19
您可以在对plotmatrix的调用中使用特定的输出参数来实现这一点。然后,您可以检索每个轴的位置并对其进行修改(使其变小)。
示例:
clc
clear

rng default
X = randn(50,3);
Y = reshape(1:150,50,3);

%// Use this output argument
[~,AX,~,~,~] = plotmatrix(X,Y);

%// Fetch all the positions and alter them (make axes smaller)
AllPos = get(AX(:),'Position');

AllPos = vertcat(AllPos{:});

NewPos = [AllPos(:,1)+.05 AllPos(:,2)+.05 AllPos(:,3)-.1 AllPos(:,4)-.1]

%// Update the plot
for k = 1:numel(AX)
    axes(AX(k))

    set(AX(k),'Position',NewPos(k,:))

    xlabel(sprintf('Axes %i',k))

end
产出如下:
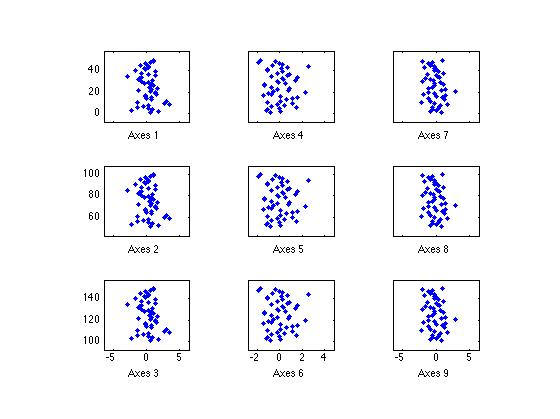
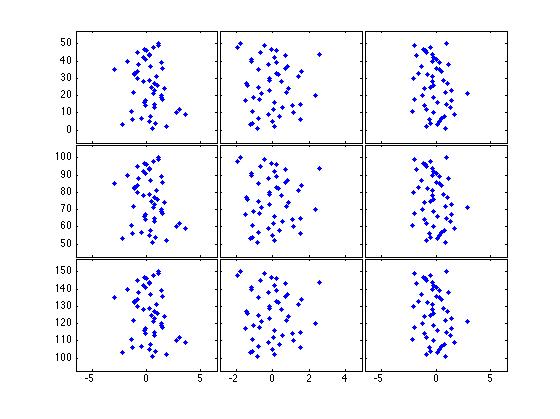
与原来的情节相反:
页面原文内容由Stack Overflow提供。腾讯云小微IT领域专用引擎提供翻译支持
原文链接:
https://stackoverflow.com/questions/29462043
复制相关文章
相似问题
腾讯云开发者

Copyright © 2013 - 2026 Tencent Cloud. All Rights Reserved. 腾讯云 版权所有
深圳市腾讯计算机系统有限公司 ICP备案/许可证号:粤B2-20090059 ![]() 粤公网安备44030502008569号
粤公网安备44030502008569号
腾讯云计算(北京)有限责任公司 京ICP证150476号 | 京ICP备11018762号