
matplotlib.figure.add_subplot.vlines取向
matplotlib.figure.add_subplot.vlines取向
提问于 2015-03-26 16:43:18
我的问题涉及vline的定位。
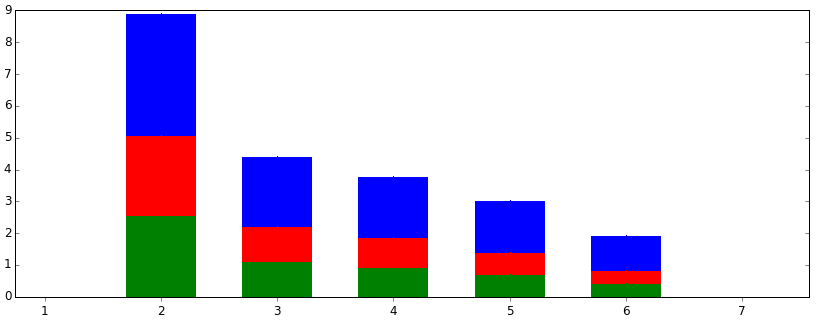
在图中,我在勾标2- 6上有厚的vline。我的目标是让这些条形线直接画在每个滴答的右边。
我需要这样做,因为当我用鼠标单击图形时,任何介于1和2之间的值都等于1。任何介于2和3之间的值都等于2。
因此,当有人去点击条子上的勾选2,如果他们点击左边的酒吧,它将等同于错误的滴答。
我希望我的问题是明确的,并感谢任何帮助。
回答 1
Stack Overflow用户
回答已采纳
发布于 2015-03-26 17:20:44
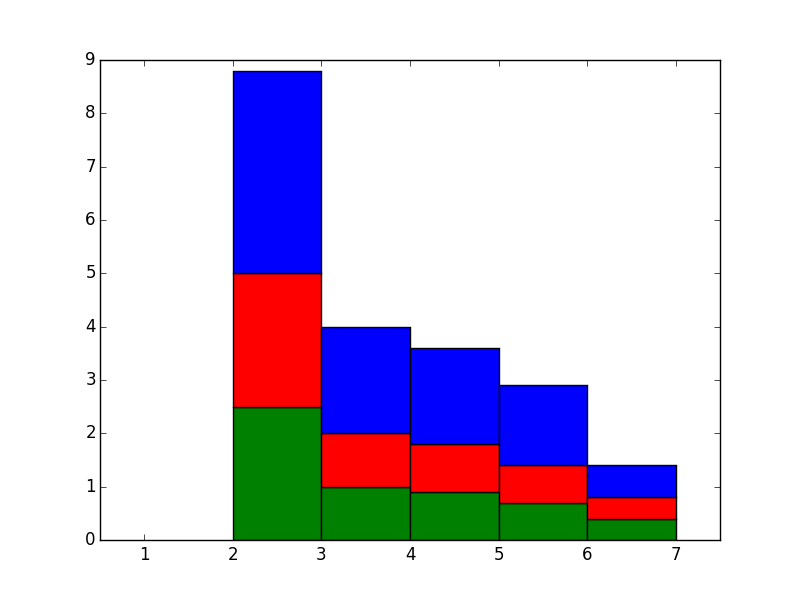
听起来你不想要vlines,而是想要矩形。
vlines (或任何一条线)的厚度是由它的笔划重量(以点为单位)控制的。这并不直接对应于图中“数据”坐标中的位置。
例如,我们可以使用ax.bar创建位于您想要的位置上的矩形:
import numpy as np
import matplotlib.pyplot as plt

# Data similar to yours
green = np.array([2.5, 1, 0.9, 0.7, 0.4])
red = green
blue = np.array([3.8, 2, 1.8, 1.5, 0.6])
x = np.arange(2, 7)

# Plot bars where the left edge will be at each x-value
fig, ax = plt.subplots()

ax.bar(x, green, width=1, color='green')
ax.bar(x, red, width=1, bottom=green, color='red')
ax.bar(x, blue, width=1, bottom=green+red, color='blue')

ax.set(xlim=[0.5, 7.5])
plt.show()
页面原文内容由Stack Overflow提供。腾讯云小微IT领域专用引擎提供翻译支持
原文链接:
https://stackoverflow.com/questions/29284192
复制相关文章
相似问题
腾讯云开发者

Copyright © 2013 - 2026 Tencent Cloud. All Rights Reserved. 腾讯云 版权所有
深圳市腾讯计算机系统有限公司 ICP备案/许可证号:粤B2-20090059 ![]() 粤公网安备44030502008569号
粤公网安备44030502008569号
腾讯云计算(北京)有限责任公司 京ICP证150476号 | 京ICP备11018762号