
无法在我闪亮的应用程序中使用反应性元素
无法在我闪亮的应用程序中使用反应性元素
提问于 2015-03-25 09:08:22
在我闪闪发亮的应用程序中,我想改变我想要构建的ggplot barChart。selectinput应该允许更改月份(见下面的数据集),因此我的绘图应该相应地更改。
问题:这个问题是,我不能使用我的反应性函数,甚至不能仅仅在ggplot函数中使用简单的input$monthid。
数据集:
Month  Orders
1   Feb  984524
2   Jan 1151303
3   Mar  575000

> dput(b)
structure(list(Month = c("Feb", "Jan", "Mar"), Orders = c(984524L,
1151303L, 575000L)), .Names = c("Month", "Orders"), class = "data.frame", row.names = c(NA,
-3L))
ui.R
library(shiny)
library(shinythemes)

b<-read.csv("b.csv",header=TRUE,sep=",",stringsAsFactors=TRUE)

shinyUI(fluidPage(theme= shinytheme("flatly"),

  sidebarLayout(
    sidebarPanel(
    selectInput(inputId = "monthid", label = "Month",choices = b$Month,selected = b$Month[1])),
    mainPanel(plotOutput("plot"))

      ))
  )
server.R
library(shiny)
library(shinythemes)
library(ggplot2)
    b<-read.csv("b.csv",header=TRUE,sep=",",stringsAsFactors=TRUE)

shinyServer(function(input, output) {


  #making a reactive object
  m<-reactive ({

    as.character(input$monthid)

    })


    output$plot<- renderPlot({

    #probably I am making a subset error in x inside aes parameter
    ggplot(data = b, aes(x = b[,m()] ,y = b$Orders)) + geom_bar(stat="identity")

    })
})回答 1
Stack Overflow用户
回答已采纳
发布于 2015-03-27 13:48:05
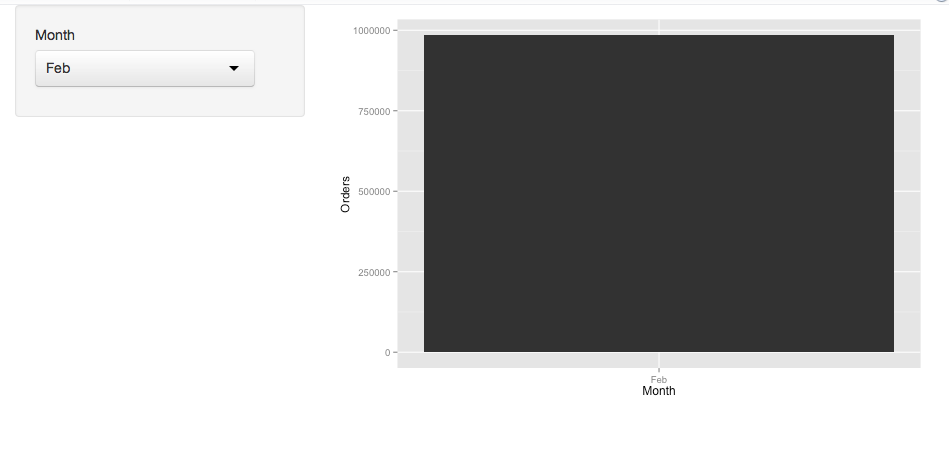
下面是一个最低限度的工作示例,您可以在会话中直接复制和粘贴以运行,但是带有单个条形图的条形图没有多大意义(如果您问我的话,它看起来很难看):
library(shiny)

shinyApp(
  ui = fluidPage(
    sidebarLayout(
      sidebarPanel(
        selectInput(
          inputId = "monthid",
          label = "Month",
          choices = b$Month,
          selected = b$Month[1]
        )
      ),
      mainPanel(plotOutput("plot"))
    )
  ),
  server = function(input, output) {
    DF <- reactive({
      b[b$Month == input$monthid, , drop = FALSE]
    })
    output$plot <- renderPlot({
      ggplot(DF(), aes(x = Month, y = Orders)) +
        geom_bar(stat = "identity")
    })
  }
)
看上去有点像这样:
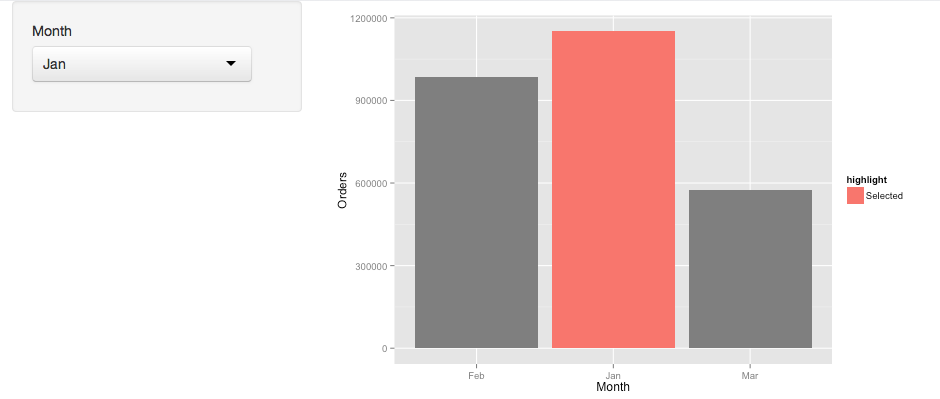
因为这看起来不太好,所以您可以通过突出当前选中的条形图来做一些事情,例如:
b$highlight <- factor("Not Selected", levels = c("Not selected", "Selected"))

shinyApp(
  ui = fluidPage(
    sidebarLayout(
      sidebarPanel(
        selectInput(
          inputId = "monthid",
          label = "Month",
          choices = b$Month,
          selected = b$Month[1]
          )
        ),
      mainPanel(plotOutput("plot"))
      )
    ),
  server = function(input, output) {
    DF <- reactive({
      b[b$Month == input$monthid, "highlight"] <- "Selected"
      b
    })
    output$plot <- renderPlot({
       ggplot(DF(), aes(x = Month, y = Orders, fill = highlight)) +
         geom_bar(stat = "identity")
    })
  }
)
这将如下所示:
页面原文内容由Stack Overflow提供。腾讯云小微IT领域专用引擎提供翻译支持
原文链接:
https://stackoverflow.com/questions/29251438
复制相关文章
相似问题
腾讯云开发者

Copyright © 2013 - 2026 Tencent Cloud. All Rights Reserved. 腾讯云 版权所有
深圳市腾讯计算机系统有限公司 ICP备案/许可证号:粤B2-20090059 ![]() 粤公网安备44030502008569号
粤公网安备44030502008569号
腾讯云计算(北京)有限责任公司 京ICP证150476号 | 京ICP备11018762号