
将XY点有条件地添加到水准图生成的栅格图中
我这里有一个棘手的ifelse任务。下面是我的代码,显示两个时间段的数据(future和current)。该数据与xy坐标一起具有mean, 5th and 95th置信范围。我想比较两个dfs的mean, 5th and 95th置信界(CI) (future和current)。
条件:
1)如果CIs for future不与current重叠,则pch=2;
2)如果CIs for future不与current和current的pch=3重叠,则pch=3;
3)如果未来的顺铂与当前的有重叠,那么pch=4
library(raster)
library(rasterVis)

    s <- stack(replicate(2, raster(matrix(runif(100), 3))))
    current <- data.frame(coordinates(sampleRandom(s, 3, sp=TRUE)),
                     C5th=c(17.643981,16.83572,9.979904),
                     CMean=c(26.66364,19.74286,15.10000),C95th=c(35.68329,22.64999,20.22010))


    future <- data.frame(coordinates(sampleRandom(s, 3, sp=TRUE)),
                          C5th=c(17.643981,16.83572,9.979904)*2,
CMean=c(26.66364,19.74286,15.10000)*2,C95th=c(35.68329,22.64999,20.22010)*2)然后将上述三个conditions的结果添加到我的地图中。类似于(仅仅是一次尝试):
levelplot(s, margin=FALSE, at=seq(0, 1, 0.05)) +
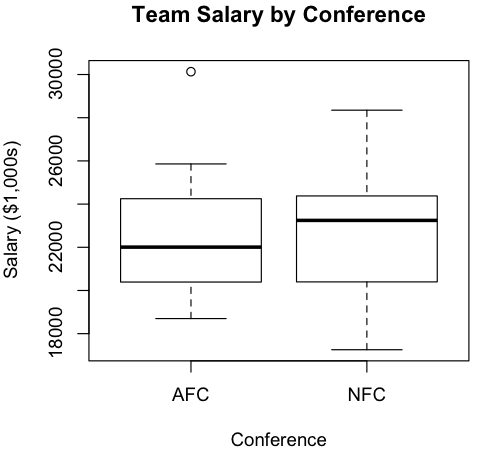
layer(sp.points(xy, pch=ifelse(condition, 2, 3,4), cex=2, col=1), columns=1) +
layer(sp.points(xy, pch=ifelse(condition, 2, 3,4), cex=2, col=1), columns=2)例如,在下图中,如果NFC (future)的最小值完全超过AFC (current)的最大值,那么就允许1.如果NFC的最大值完全低于AFC的最小值,那么condtion 1.如下所示的图满足条件3。
请帮帮忙。在…。
回答 1
Stack Overflow用户
发布于 2015-03-22 15:05:15
如果您定义了一个完整的SpatialPointsDataFrame对象,并根据您需要的条件定义了一个额外的分类变量,那就更容易了。
library(raster)
library(rasterVis)

s <- stack(replicate(2, raster(matrix(runif(1000), 3))))
## Coordinates
cc <- sampleRandom(s, 3, sp = TRUE)
## Data
current <- data.frame(C5th=c(17.643981,16.83572,9.979904),
                      CMean=c(26.66364,19.74286,15.10000),
                      C95th=c(35.68329,22.64999,20.22010))

future <- data.frame(C5th=c(17.643981,16.83572,9.979904)*2,
                     CMean=c(26.66364,19.74286,15.10000)*2,
                     C95th=c(35.68329,22.64999,20.22010)*2)

cf <- data.frame(current, future)
## Define a categorical variable checking the conditions you need
cf$class <- with(cf,
                 ifelse(C5th > C95th.1, 'A',
                        ifelse(C95th < C5th.1, 'B',
                               ifelse(C5th < C95th.1 && C5th > C5th.1, 'C', 'D')
                               )
                        )
                 )
cf$class <- factor(cf$class)

## Build a SPDF object with the coordinates and data
pp <- SpatialPointsDataFrame(cc, cf)这个对象可以用spplot显示。有了它,你可以选择符号,大小等。
levelplot(s) + spplot(pp["class"],
                      pch = 21:23,
col.regions = 'gray')https://stackoverflow.com/questions/29178553
复制相似问题
腾讯云开发者

Copyright © 2013 - 2026 Tencent Cloud. All Rights Reserved. 腾讯云 版权所有
深圳市腾讯计算机系统有限公司 ICP备案/许可证号:粤B2-20090059 ![]() 粤公网安备44030502008569号
粤公网安备44030502008569号
腾讯云计算(北京)有限责任公司 京ICP证150476号 | 京ICP备11018762号