
如何在matlab中标出具有峰值的图形
如何在matlab中标出具有峰值的图形
提问于 2015-02-25 06:17:52
我试图给有峰的XRD数据贴上标签,我想从我的一系列数据中给它贴上标签:
  peak label
    ab
    ac
    ad
    cb
    bb
    ba
见下图
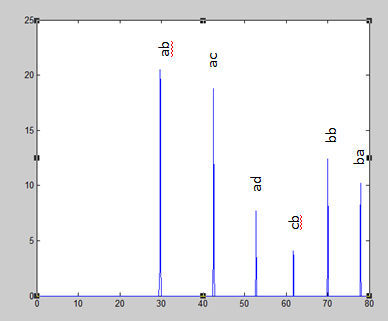
我也希望那些标签垂直对齐在顶部的峰值。我尝试了findpeaks函数,但它不起作用。
回答 1
Stack Overflow用户
回答已采纳
发布于 2015-02-25 06:58:18
试试这个(但是您需要有一个信号处理工具箱):
x = [1 2 3 4 5 6 7 8 9]
y = [1 4 2 7 3 9 5 10 2]
[peak, peakId] = findpeaks(y); %find peaks in your serie
figure(1)
plot(x, y)
lbalph=('a':'z').'
lb=strcat(Alphabet(1),lbalph(1:length(peak))) %Create a label matrix
lb = num2cell(lb,2) % Convert to cell array
lbid = 1:length(lb)
text(x(peakId), peak, lb(lbid),'Rotation',90) % label the peak with your lb matrix
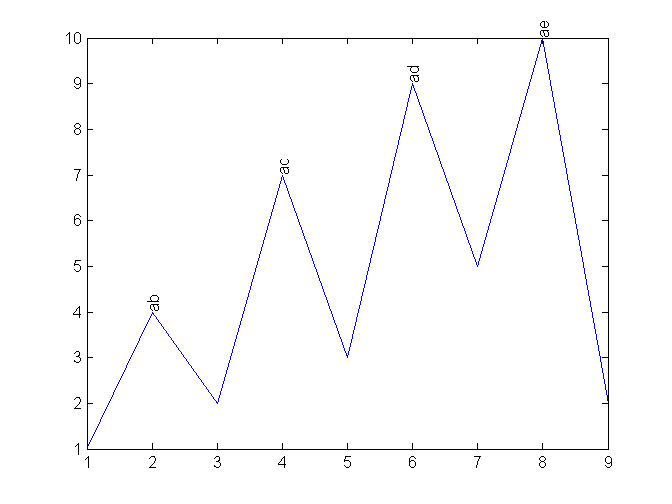
因为你有指数峰值,你可以标记你想要的。
页面原文内容由Stack Overflow提供。腾讯云小微IT领域专用引擎提供翻译支持
原文链接:
https://stackoverflow.com/questions/28712464
复制相关文章
相似问题
腾讯云开发者

Copyright © 2013 - 2026 Tencent Cloud. All Rights Reserved. 腾讯云 版权所有
深圳市腾讯计算机系统有限公司 ICP备案/许可证号:粤B2-20090059 ![]() 粤公网安备44030502008569号
粤公网安备44030502008569号
腾讯云计算(北京)有限责任公司 京ICP证150476号 | 京ICP备11018762号