
如何用高图表制作讲台
如何用高图表制作讲台
提问于 2015-02-13 08:26:27
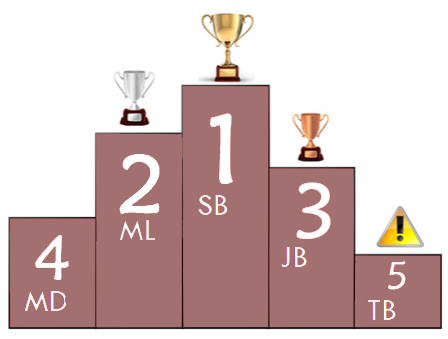
这是我的图表>> 单击此处。我想用高图表来做这样的视图
这样能在图表上添加不同的图片吗?
我已经用dataLabel来显示图表中的标签。这是我的密码:
 series: [{
        name: 'RATING',
        data:[
            ['MD', 2],
            ['ML', 4],
            ['SB', 5],
            ['JB', 3],
            ['TB', 1]
            ],
        dataLabels: {
            enabled: true,
            color: 'white',
            align: 'center',
            x: 3,
            y: 10,
            style: {
                fontSize: '50px',
                fontFamily: 'Verdana, sans-serif',
                textShadow: '0 0 3px black'
            }
        }
    }]
但结果却是这样:
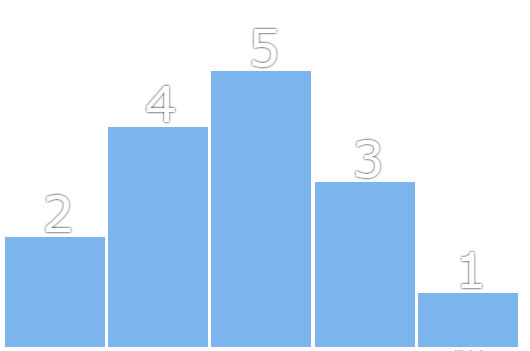
你能给我一个解决问题的建议吗?谢谢。
回答 1
Stack Overflow用户
回答已采纳
发布于 2015-02-13 10:24:50
可以将useHTML选项设置为true,然后将用户格式化程序设置为生成图像:http://jsfiddle.net/ypb6zwd3/3/
现在,只需进行一些抛光,就可以按您想要的方式放置标签:
            y: 60, // position label in a proper place
            useHTML: true, // required
            overflow: false, //disable overflow
            crop: false, // disable cropping
            formatter: function() {
                  return '<img src="http://highcharts.com/demo/gfx/sun.png" /> <br>' + (6 - this.y);   // <br> tag breaks dataLabel into two lines
            },
现在,您所需要做的就是为每个列提供适当的图像url。
页面原文内容由Stack Overflow提供。腾讯云小微IT领域专用引擎提供翻译支持
原文链接:
https://stackoverflow.com/questions/28495286
复制相关文章
相似问题
腾讯云开发者

Copyright © 2013 - 2026 Tencent Cloud. All Rights Reserved. 腾讯云 版权所有
深圳市腾讯计算机系统有限公司 ICP备案/许可证号:粤B2-20090059 ![]() 粤公网安备44030502008569号
粤公网安备44030502008569号
腾讯云计算(北京)有限责任公司 京ICP证150476号 | 京ICP备11018762号