
Matplotlib:如何使我的条形图填充整个x轴?
Matplotlib:如何使我的条形图填充整个x轴?
提问于 2015-02-12 17:48:04
我在matplotlib中绘制了这样一个条形图:
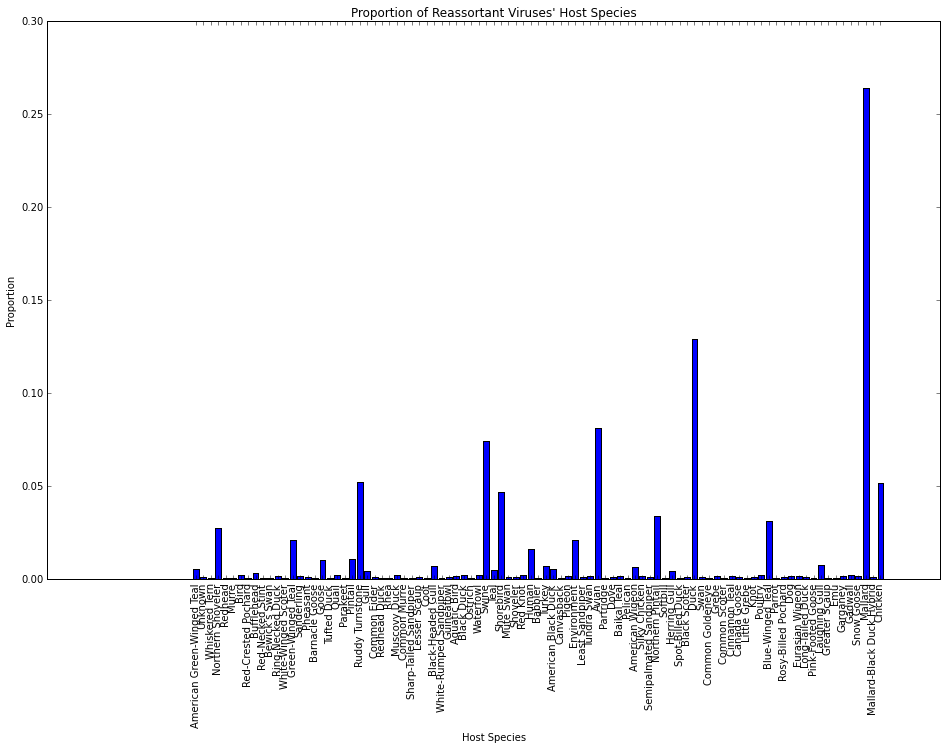
X-蜱不跨越x轴的整个范围.我怎样才能做到这一点?
我的密码在这里:
def counter_proportions(counter):
    total = sum(counter.values())

    proportions = dict()
    for key, value in counter.items():
        proportions[key] = float(value)/float(total)

    return proportions

def categorical_counter_xlabels(counter):
    idxs = dict()

    for i, key in enumerate(counter.keys()):
        idxs[key] = i

    return idxs

# Use this dummy data
detailed_hosts = ['Species1' * 3, 'Species2' * 1000, 'Species3' * 20, 'Species4' * 20]
# Create a detailed version of the counter, which includes the exact species represented.
detailed_hosts = []

counts = Counter(detailed_hosts)
props = counter_proportions(counts)
xpos = categorical_counter_xlabels(counts)

fig = plt.figure(figsize=(16,10))
ax = fig.add_subplot(111)
plt.bar(xpos.values(), props.values(), align='center')
plt.xticks(xpos.values(), xpos.keys(), rotation=90)
plt.xlabel('Host Species')
plt.ylabel('Proportion')
plt.title("Proportion of Reassortant Viruses' Host Species")
plt.savefig('Proportion of Reassortant Viruses Host Species.pdf', bbox_inches='tight')回答 1
Stack Overflow用户
回答已采纳
发布于 2015-02-12 18:16:30
手动棒间距
您可以手动控制条形图的位置(例如,它们之间的间距),但是使用字典--而是尝试使用一个整数列表。
Import scipy

xticks_pos = scipy.arange( len( counts.keys() )) +1

plt.bar( xticks_pos, props.values(), align='center')
如果您缺少this,并且不需要安装它,那么arange()就会产生这样的结果:
In [5]: xticks_pos

Out[5]: array([ 1,  2,  3,  4,  5,  6,  7,  8,  9, 10])
控制边距
如@JoeKington在评论中提到的,您可以控制其他部分(例如,如果您不想控制间距,而是希望限制边距,等等):
plt.axis('tight')

plt.margins(0.05, 0)

plt.xlim(x.min() - width, x.max() + width))页面原文内容由Stack Overflow提供。腾讯云小微IT领域专用引擎提供翻译支持
原文链接:
https://stackoverflow.com/questions/28484329
复制相关文章
相似问题
腾讯云开发者

Copyright © 2013 - 2026 Tencent Cloud. All Rights Reserved. 腾讯云 版权所有
深圳市腾讯计算机系统有限公司 ICP备案/许可证号:粤B2-20090059 ![]() 粤公网安备44030502008569号
粤公网安备44030502008569号
腾讯云计算(北京)有限责任公司 京ICP证150476号 | 京ICP备11018762号