
用rworldmap显示的地块上的国家名称
用rworldmap显示的地块上的国家名称
提问于 2015-02-12 04:42:35
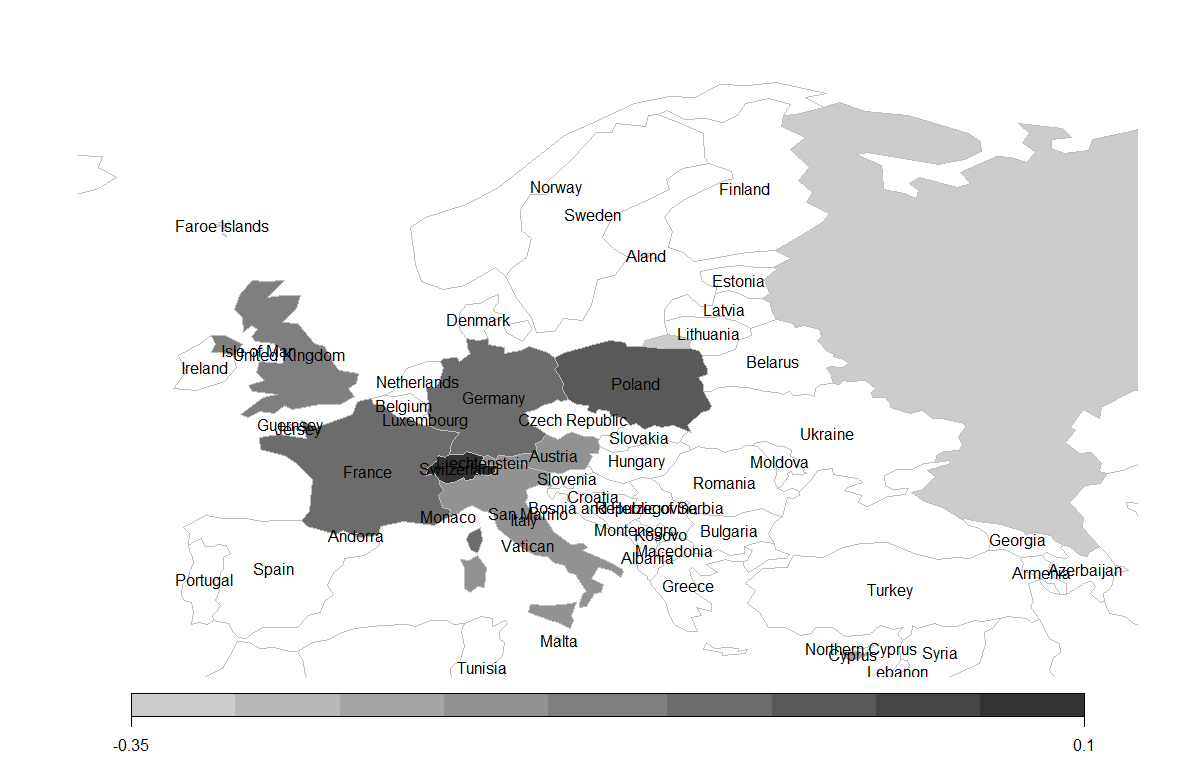
早上好,我花了很多时间想办法把一个国家的名字直接加在情节上--不是传说的一部分,而是地图的一部分。我正在使用软件包rworldmap,尝试使用identifyCountries () --但是它适用于交互(当用户单击地图时),而不是我已经找到了这样的解决方案-- Administrative regions map of a country with ggmap and ggplot2,但它是针对ggplot2的,而且太复杂了。我试着用mapCountryData()做这件事。希望你能帮忙谢谢。
data <- data.frame(Country=c('Russia','Cyprus', 'Belize', 'Austria' ,'Virgin Islands',
        'Italy','United States' ,'United Kingdom', 'Germany', 'France' ,'Poland' ,'Switzerland'),
Value=c(-0.310,-0.206,-0.300,-0.179,-0.196,-0.174,-0.105,-0.142,-0.082,-0.097,-0.027,0.052))

    library('rworldmap')

    pdf1 <- joinCountryData2Map(data, joinCode="NAME", nameJoinColumn="Country")

    mapCountryData(pdf1, nameColumnToPlot="Value", catMethod="pretty",
colourPalette='white2Black',addLegend='TRUE',mapTitle=NULL, mapRegion="Europe")回答 1
Stack Overflow用户
回答已采纳
发布于 2015-02-12 07:55:58
你可以试试:
# get the coordinates for each country
country_coord<-data.frame(coordinates(pdf1),stringsAsFactors=F)
# label the countries
text(x=country_coord$X1,y=country_coord$X2,labels=row.names(country_coord))
在代码后传递这些行,您将得到:
页面原文内容由Stack Overflow提供。腾讯云小微IT领域专用引擎提供翻译支持
原文链接:
https://stackoverflow.com/questions/28469444
复制相关文章
相似问题
腾讯云开发者

Copyright © 2013 - 2026 Tencent Cloud. All Rights Reserved. 腾讯云 版权所有
深圳市腾讯计算机系统有限公司 ICP备案/许可证号:粤B2-20090059 ![]() 粤公网安备44030502008569号
粤公网安备44030502008569号
腾讯云计算(北京)有限责任公司 京ICP证150476号 | 京ICP备11018762号